

Reports are useful both when you are just starting your journey with LiveChat and want to set up your account. And any time after the initial set-up, as they give you an overview of how LiveChat and your agents are performing.
Reports available on the Team, Business, and Enterprise plans
Last 7 days report
Gives you a general idea of what is going on your license, showing metrics like the number of chats, sales, or ticket and chat satisfaction. Perfect for quick checks to see if everything is the way it should be.
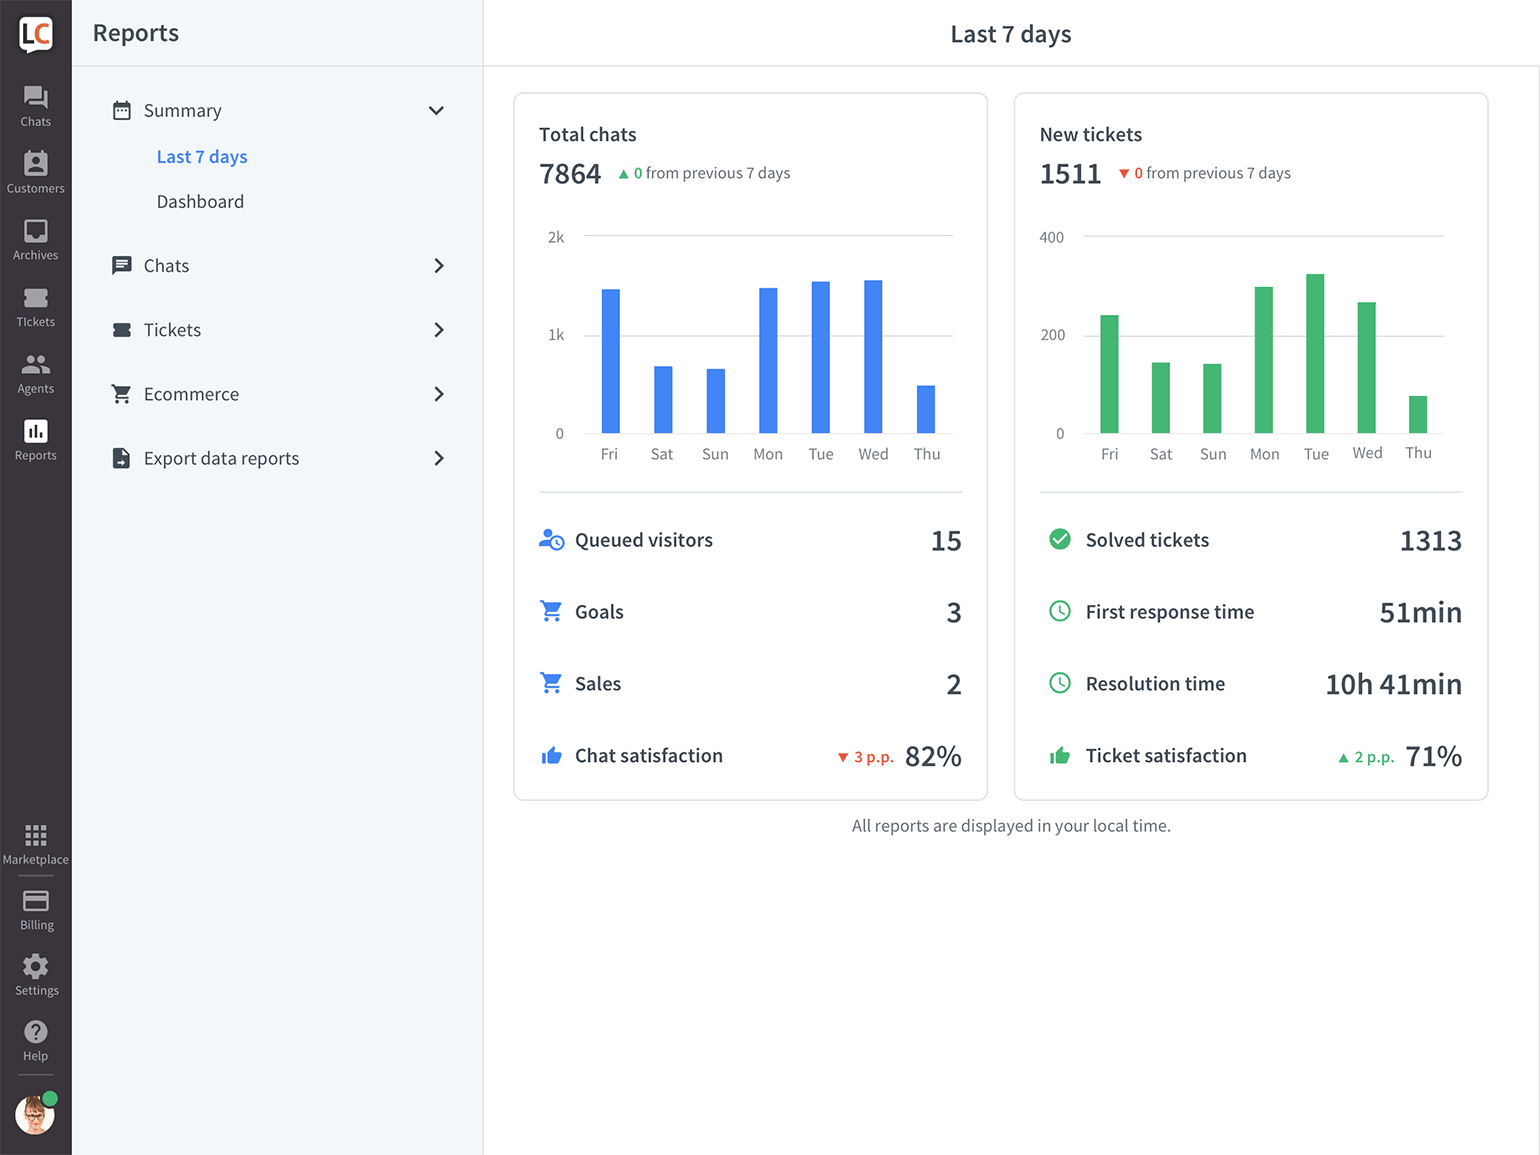
There are two sections, each presenting data about either chats or tickets. When you click on a metric, a full report view appears.
Chats
- Total chats—shows the total number of chats this week. Check how it compares to the number of chats from the previous 7 days. Look at the bar chart to see how the numbers distributed on particular days of the week.
- Queued visitors—shows the total number of customers who were in the queue during the week. Make sure that the number of queued visitors isn’t getting too high. If it is, you should consider adding more agents online.
- Goals—shows how many goals you and your agents achieved with LiveChat. Set up Goals to automatically see how many chats ended with a needed result, e.g., a positive rating.
- Sales—see how many sales were accomplished with LiveChat. You can turn on the Sales Tracker, so each successful transactions shows in LiveChat reports.
- Chat satisfaction—shows the percentage of chats that were rated positively. Keep track of this metric to ensure high customer satisfaction.
Tickets
- New tickets—shows the total number of tickets (coming from support email and ticket form) this week. Check how it compares to the number of tickets from the previous 7 days. Look at the bar chart to see how the numbers distributed on particular days of the week.
- Solved tickets—shows how many tickets agents solved this week. Make sure your agents take care of tickets daily, so they don’t pile up.
- First response time—shows average time it takes your agents to answer for the first time. The lower it is, the happier your customers are—as no one likes to wait.
- Resolution time—shows the average time it takes for your agents to solve a case. As with first response time—the lower, the better.
- Ticket satisfaction—shows the percentage of tickets that were rated positively. Your customers get a follow-up email that lets them rate the agent. It is sent 24h after the case was resolved.
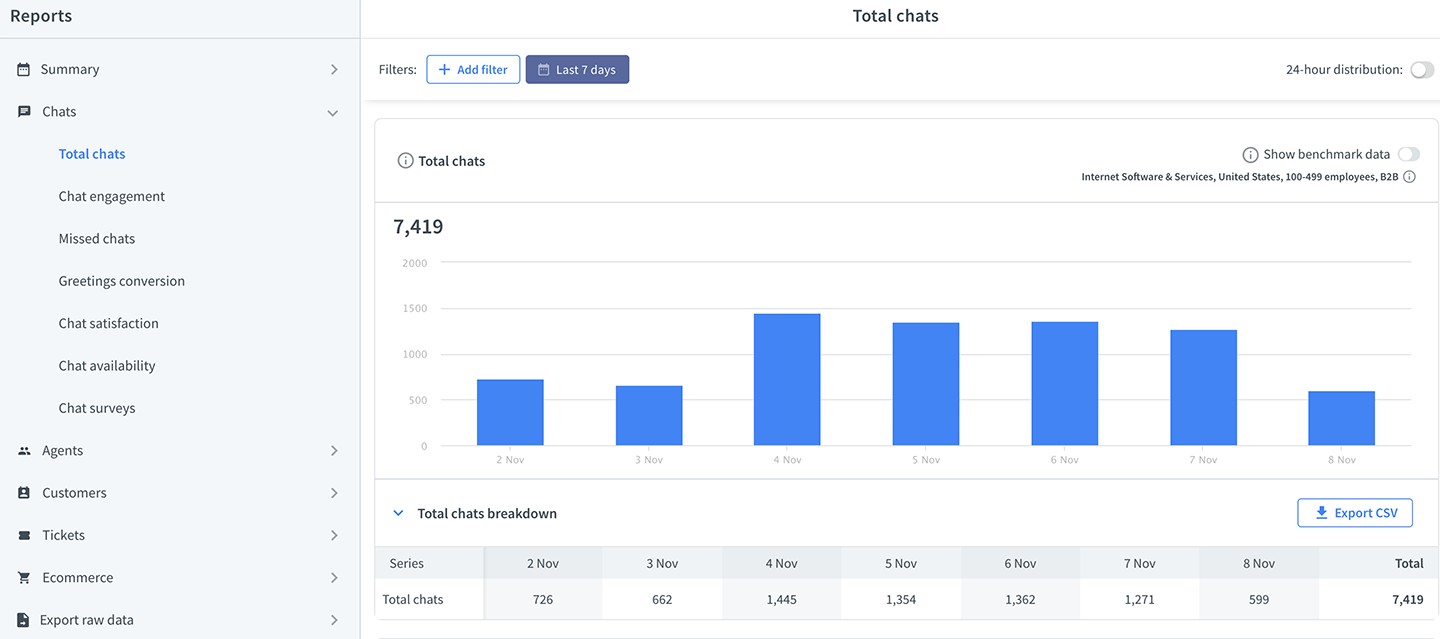
Total chats report
View how many chats are coming your way on a particular day and at a particular time. It’s handy to see if your efforts to increase/decrease the number of chats are working and to estimate how many agents you need on a specific shift.
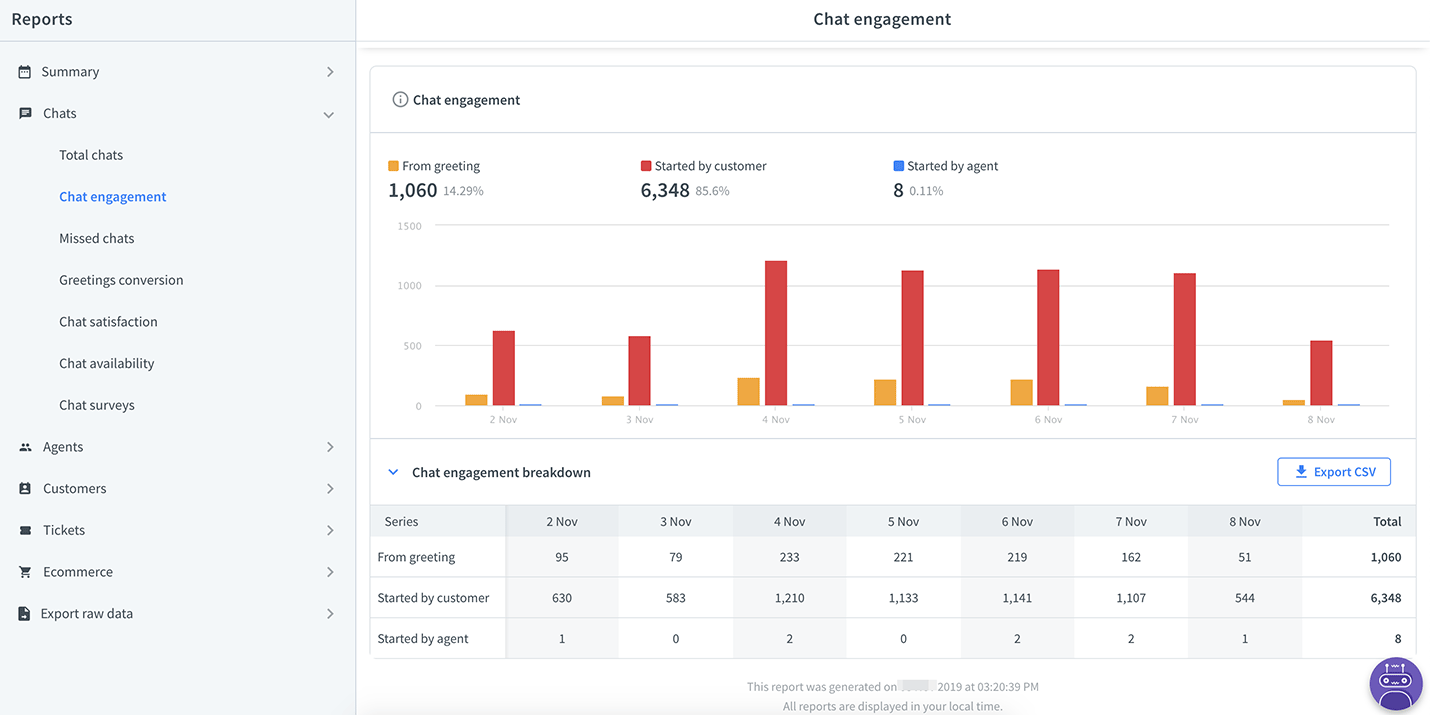
Chat engagement report
Check where your chats are coming from. Depending on your team’s process, you might want to track the number of chats started from ‘campaigns.’ The higher, the better as it means your agents can talk to your targeted audience.
Missed chats report
With the missed chats report, you can check which visitors didn’t get a reply from your agents and left the chat. This report helps you both keep an eye on the numbers as well as follow up on particular cases.
A chat counts as missed if there was no reply either from an agent or a bot.
Missed chats chart
If you miss a lot of chats, think about decreasing the concurrent chat limit or hiring more agents. It’s best to keep this metric low—customers might feel frustrated if they start a chat and don’t get an answer at all.

Click on the chart to see chats from a specific period in Archives. If a visitor has left an email address, you are able to follow up with them and answer their question.

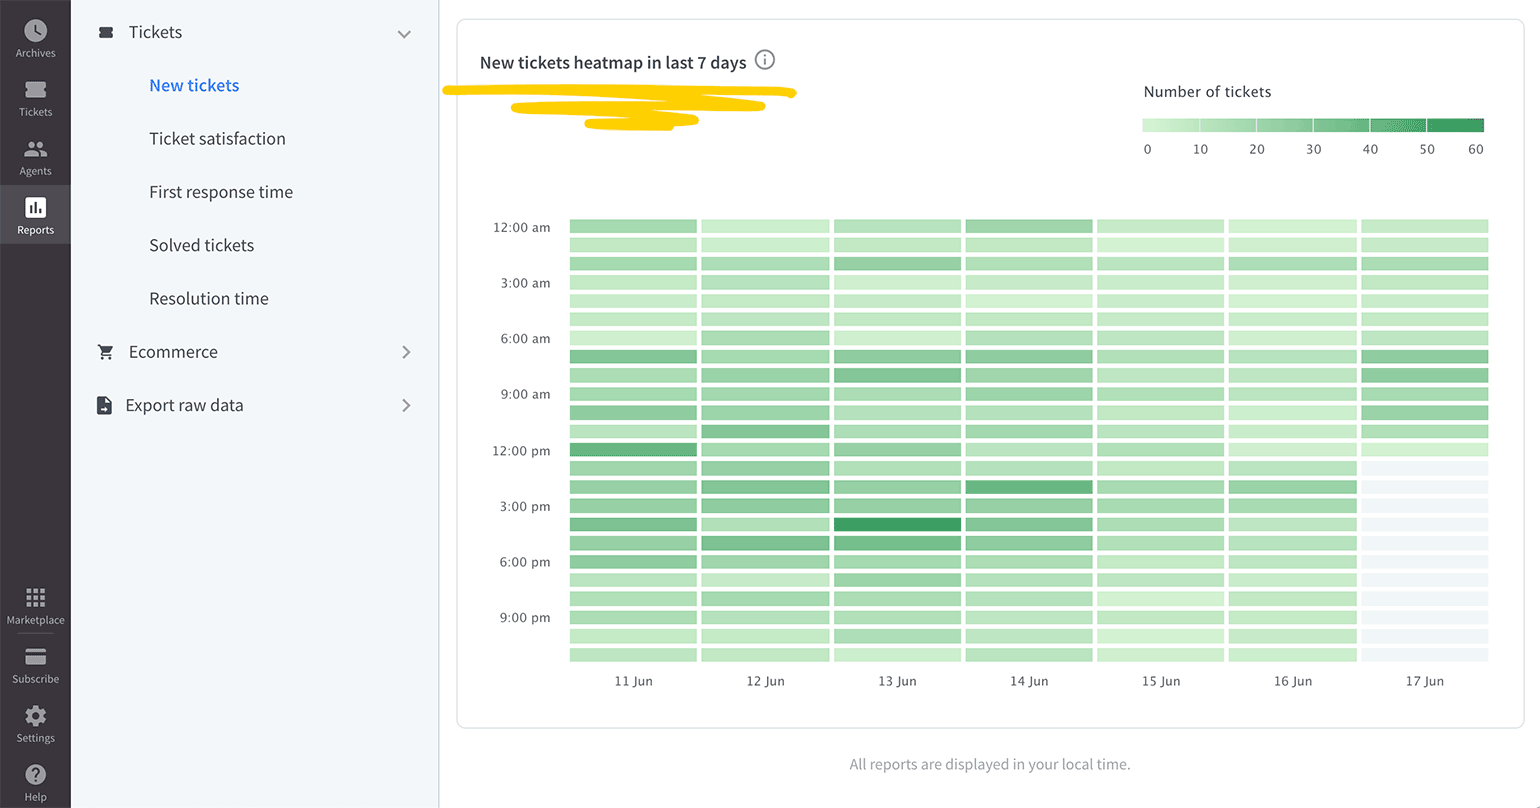
Missed chats heatmap
Check when during the day you miss the most chats. Light colors mean the quietest hours; darker colors mean the busiest.

Plan your team’s schedule according to this data, so there are more agents during busy periods.
Campaigns conversion report
Using campaigns is the most effective way to get more chats. Apply filters to see how specific campaigns are performing. Do tests to see if changing the campaign’s copy or trigger helps with the conversion rates.

Tags usage report
If you use tags to segment the types of queries your team handles, this report will show which topics are the most common, or which teams are the busiest.
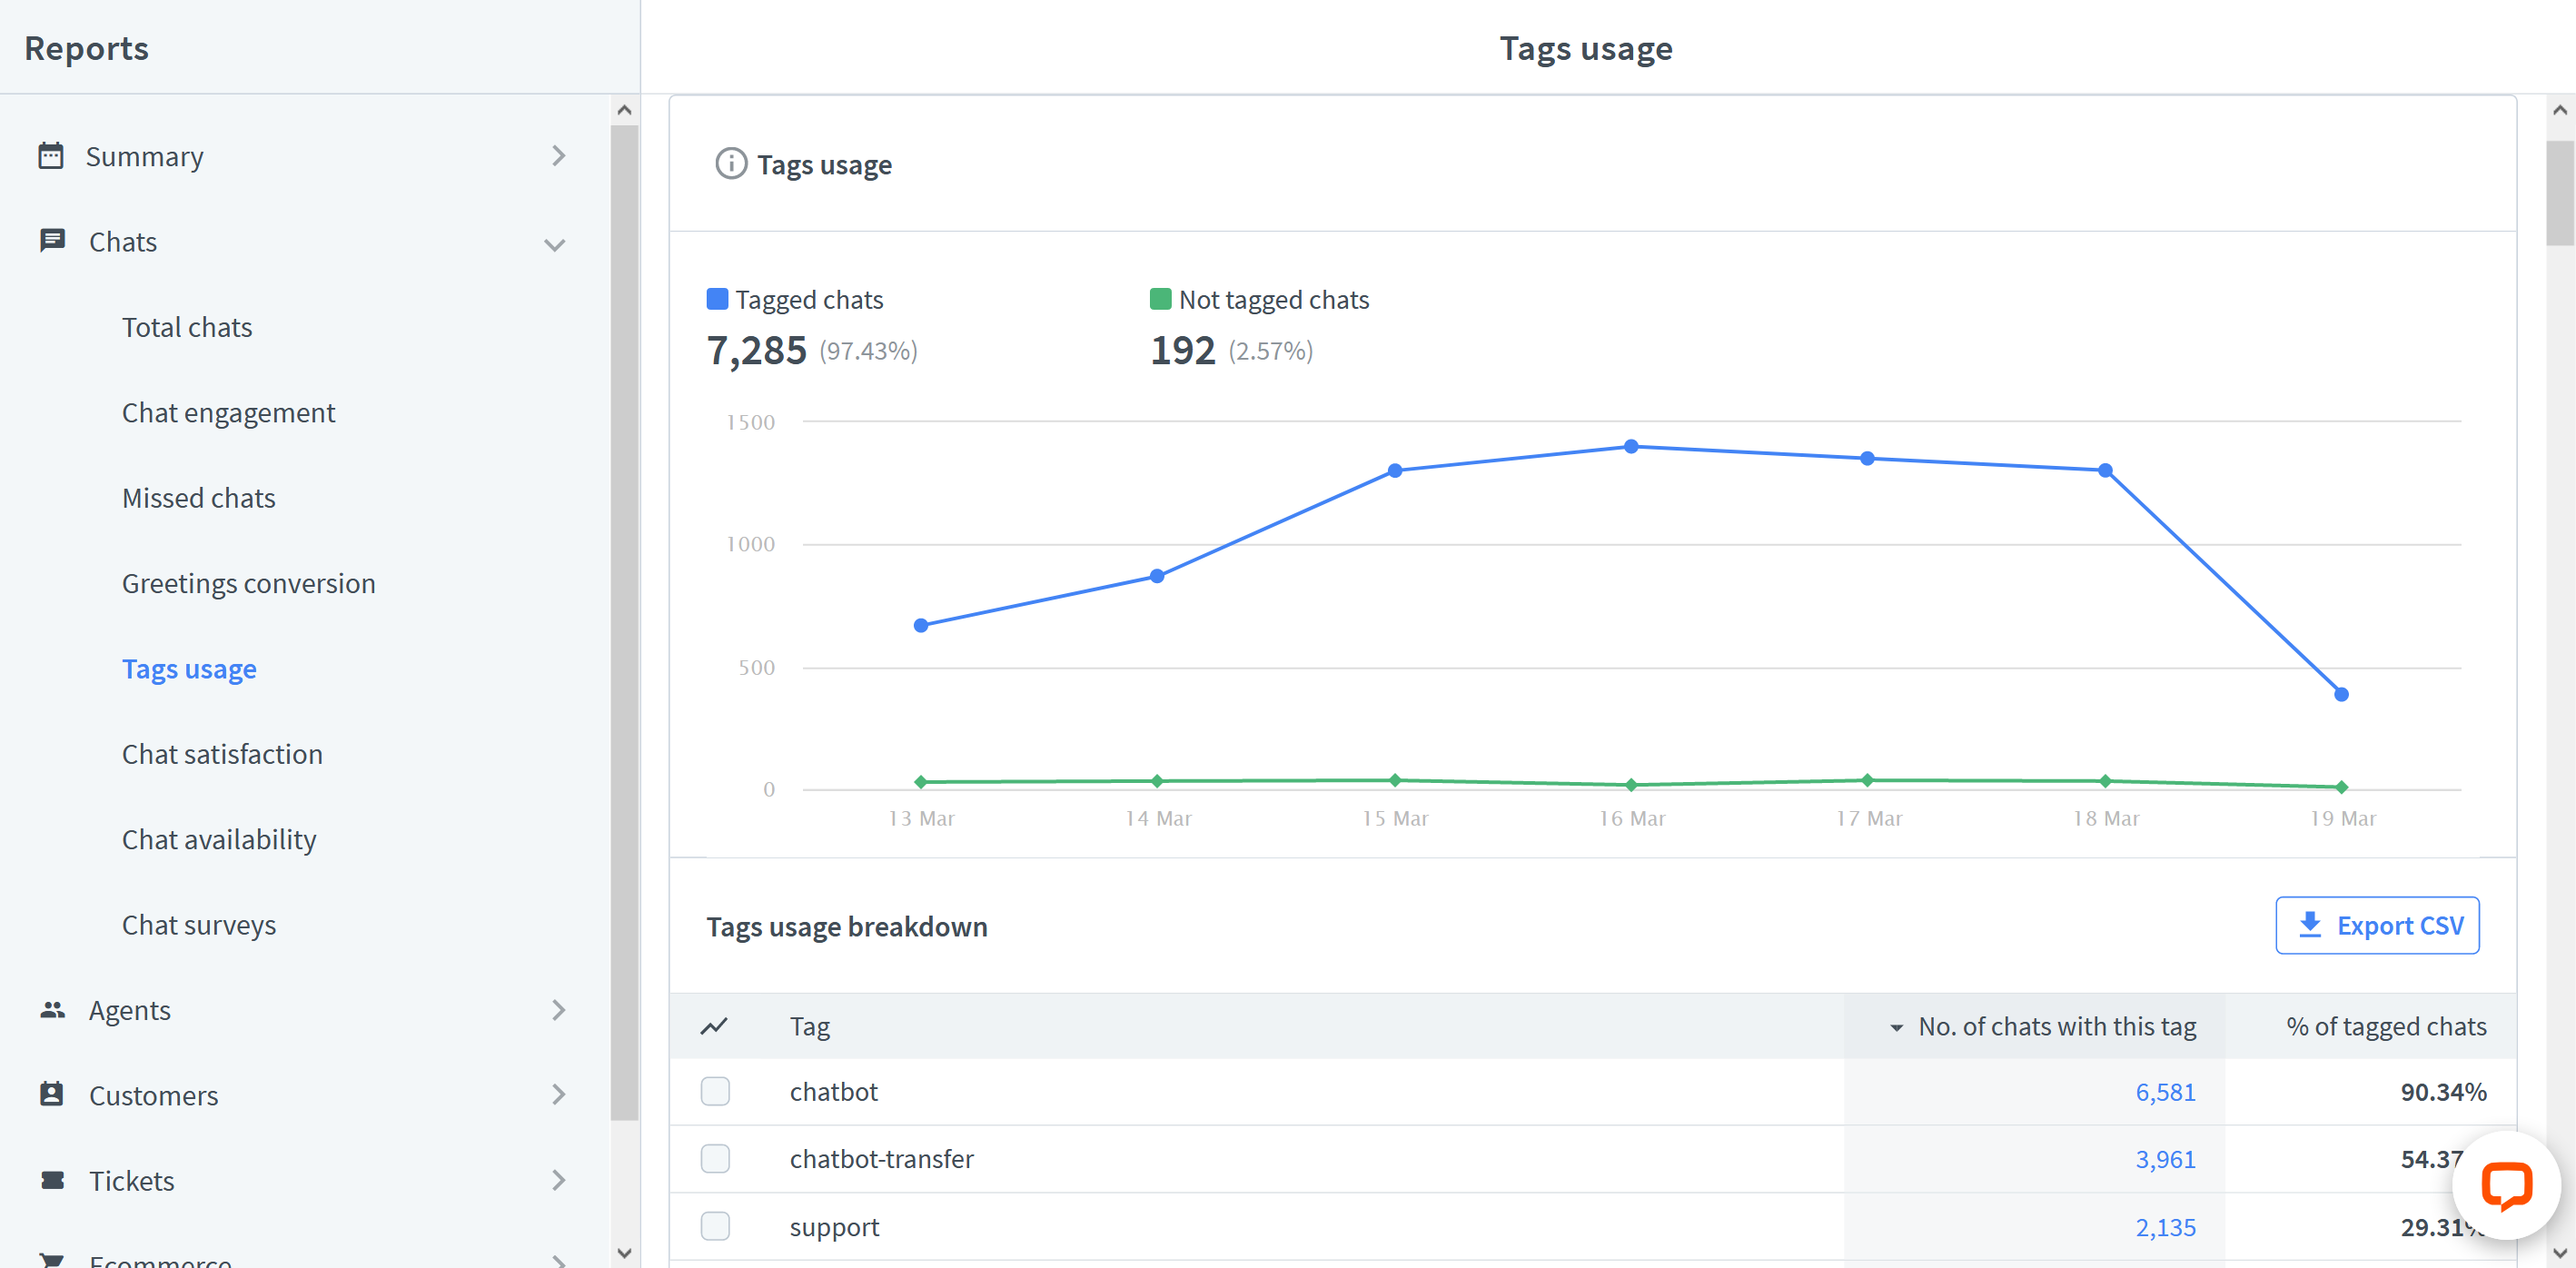
To see chats with a specific tag in Archives, choose the tag from the table and click on the chart.
Chat satisfaction report
This report shows you how happy your customers are with your service. It lists all your ‘good’ and ‘bad’ ratings and gives you the overall satisfaction score. If you are consistently tagging your chats, you can see how particular types of cases, e.g., sales chats, are rated in comparison to other chat types.

If you want to access the rated chats quickly, click on the bar representing the ‘good’ or ‘bad’ rates to see those chats in the Archives.
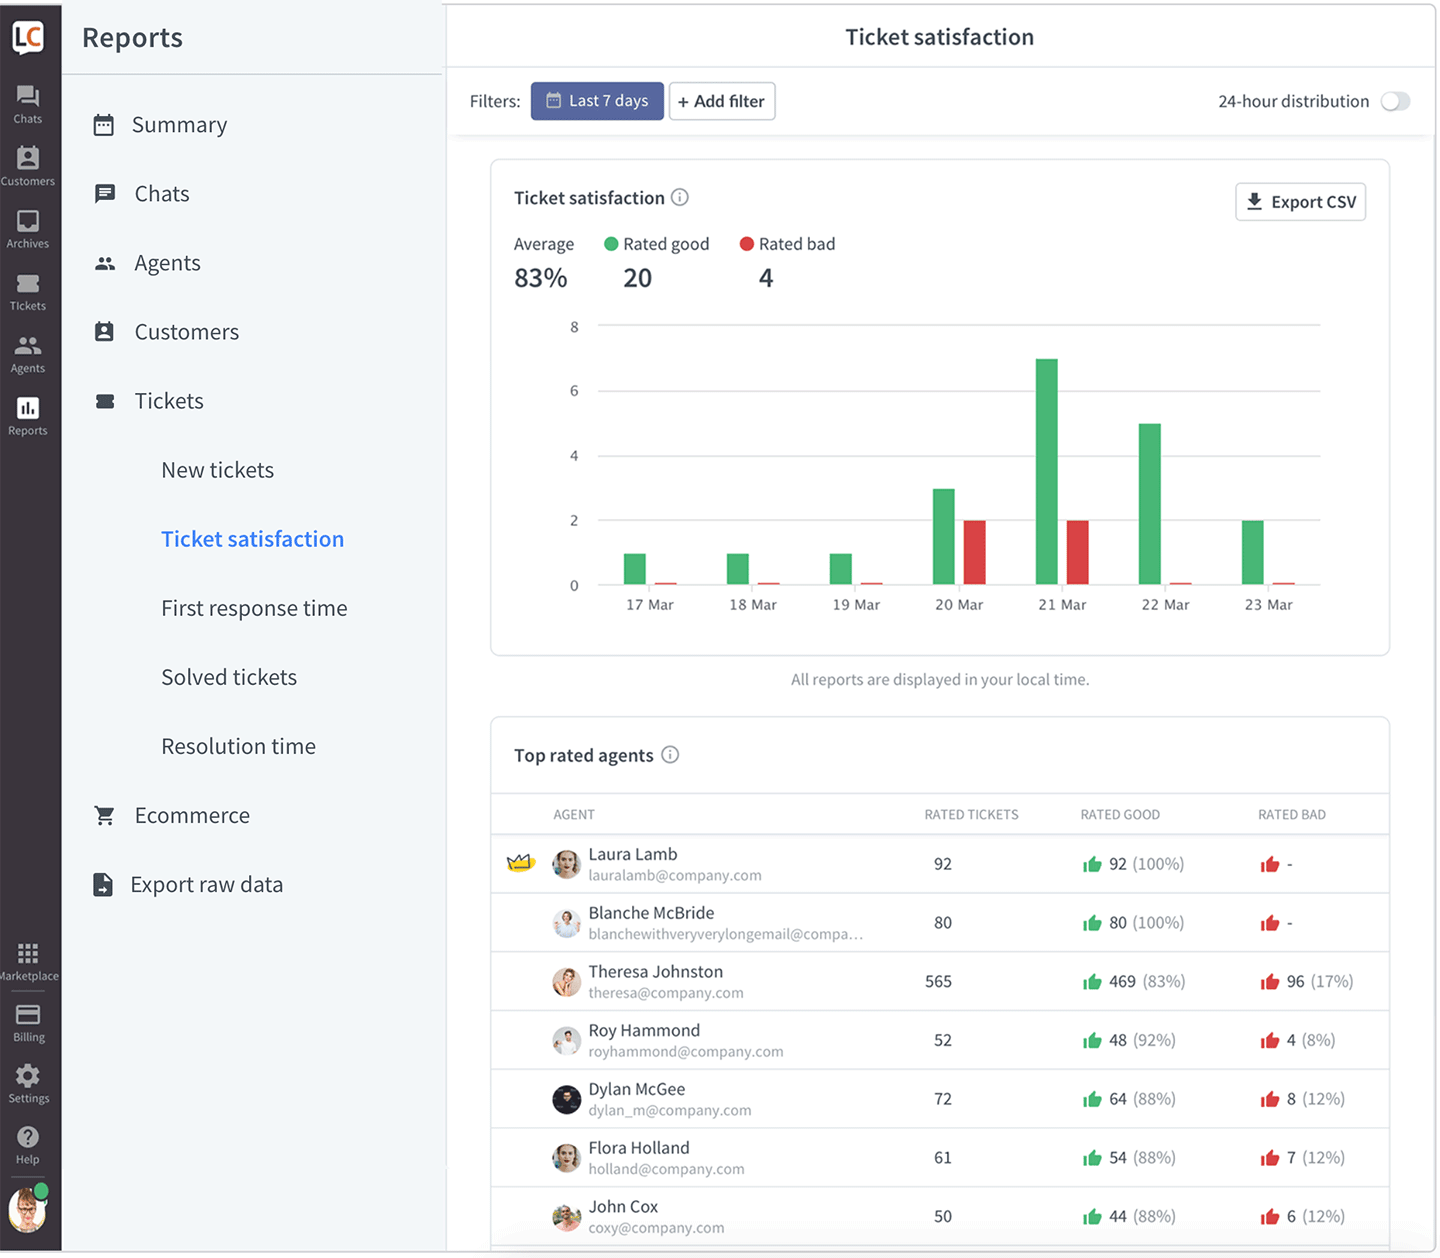
The report also provides a list of your agents ranked by chat satisfaction. Make note that the rankings are based on the probability of getting a positive chat, not the average chat rating. Read more on how we calculate chat satisfaction.
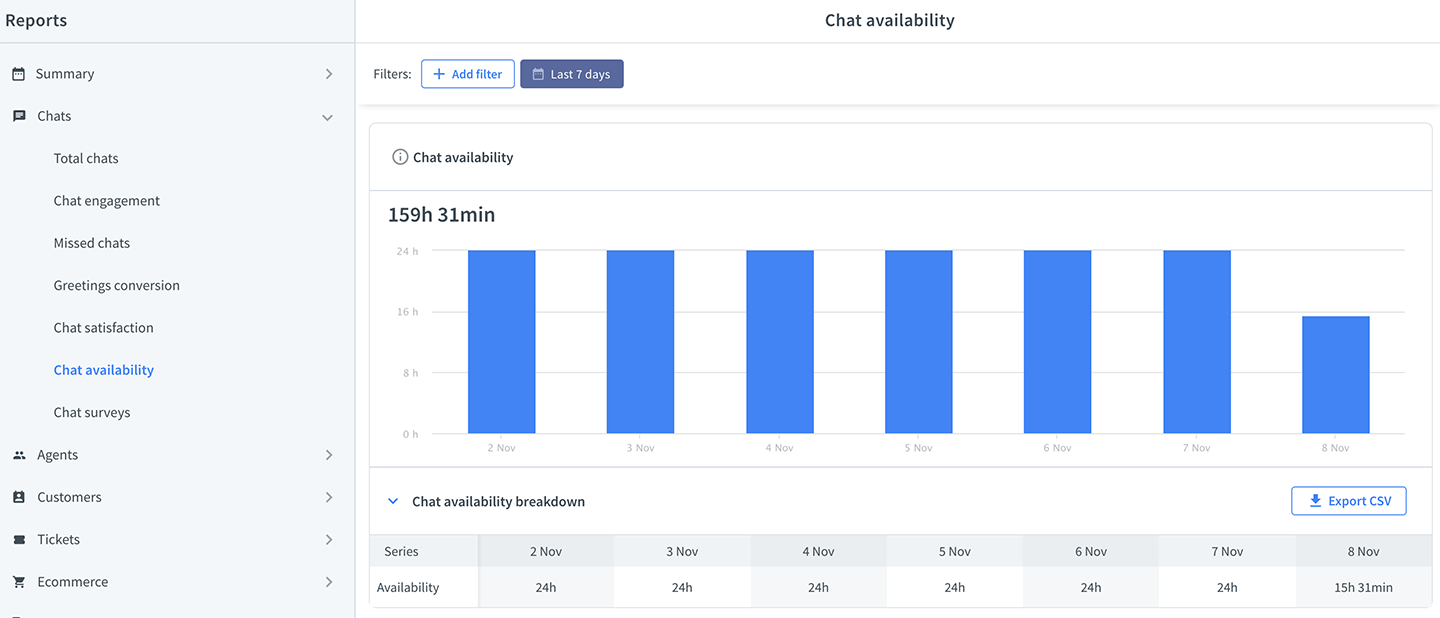
Chat availability report
Check for how long live chat is online on your page. The longer you are available to your customers, the more opportunities you have to make sales.
Queued customers report
See how many customers waited in the queue and how many left before getting connected to an agent. Check the average waiting time before entering a chat, and how long it takes for your customers to get impatient and leave the queue.
Queue conversion
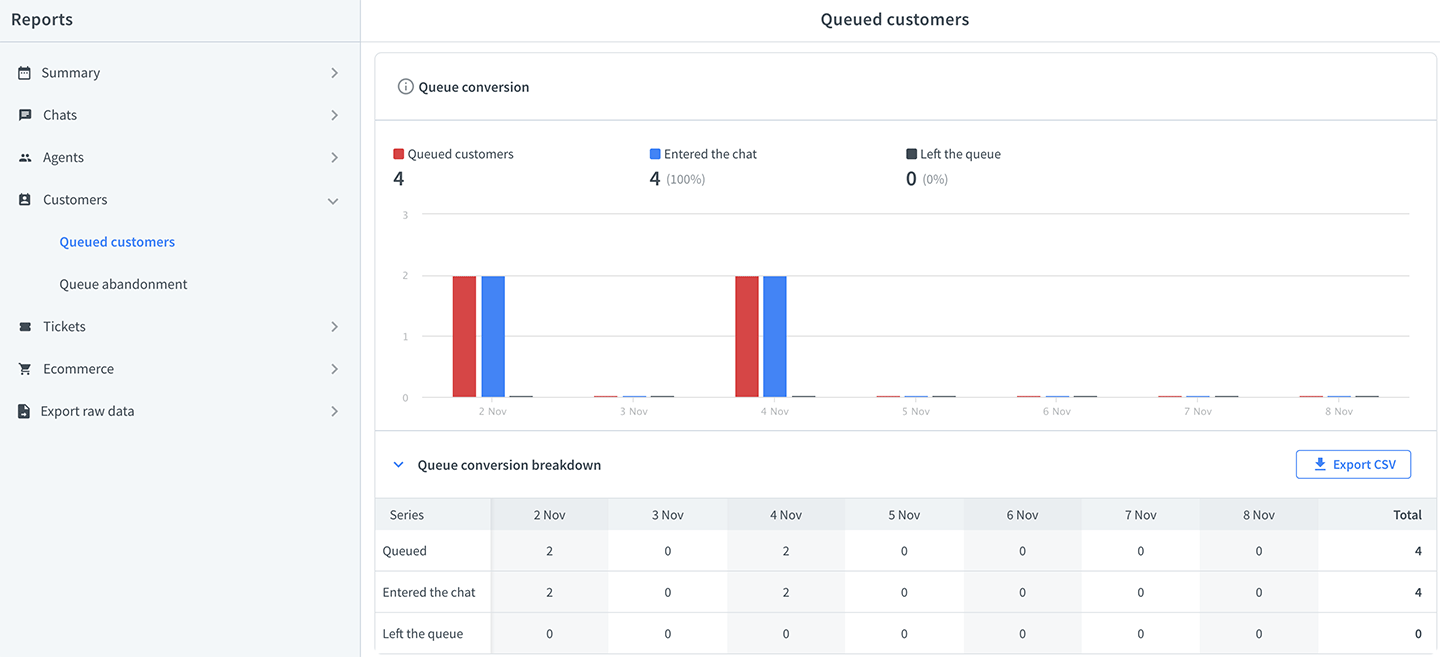
The chart shows you the number of visitors who:
- entered a queue
- were connected to an agent
- left the queue before they could talk to an agent
You can expect higher abandonment rates the longer it takes to enter a chat. You can learn more about the waiting times from the average waiting time chart.
Average waiting time
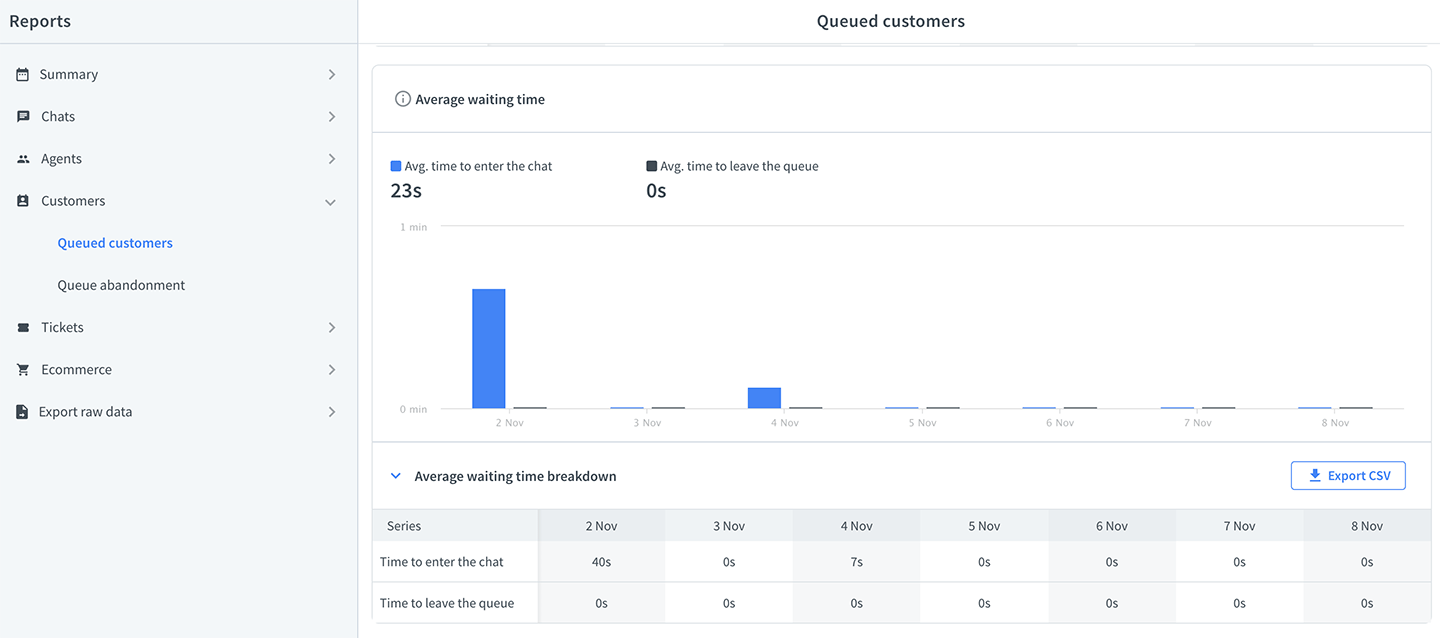
- visitors wait before entering chat
- visitors wait before they leave the queue
See how long it takes for your customers on average to leave the queue, and try to make the average waiting time a little bit shorter. Don’t miss on potential customers because they got impatient.
Queued customers heatmap

Check out the heatmap to see when the number of queued visitors is the highest. If possible, try adding more agents at peak times to reduce the waiting time.
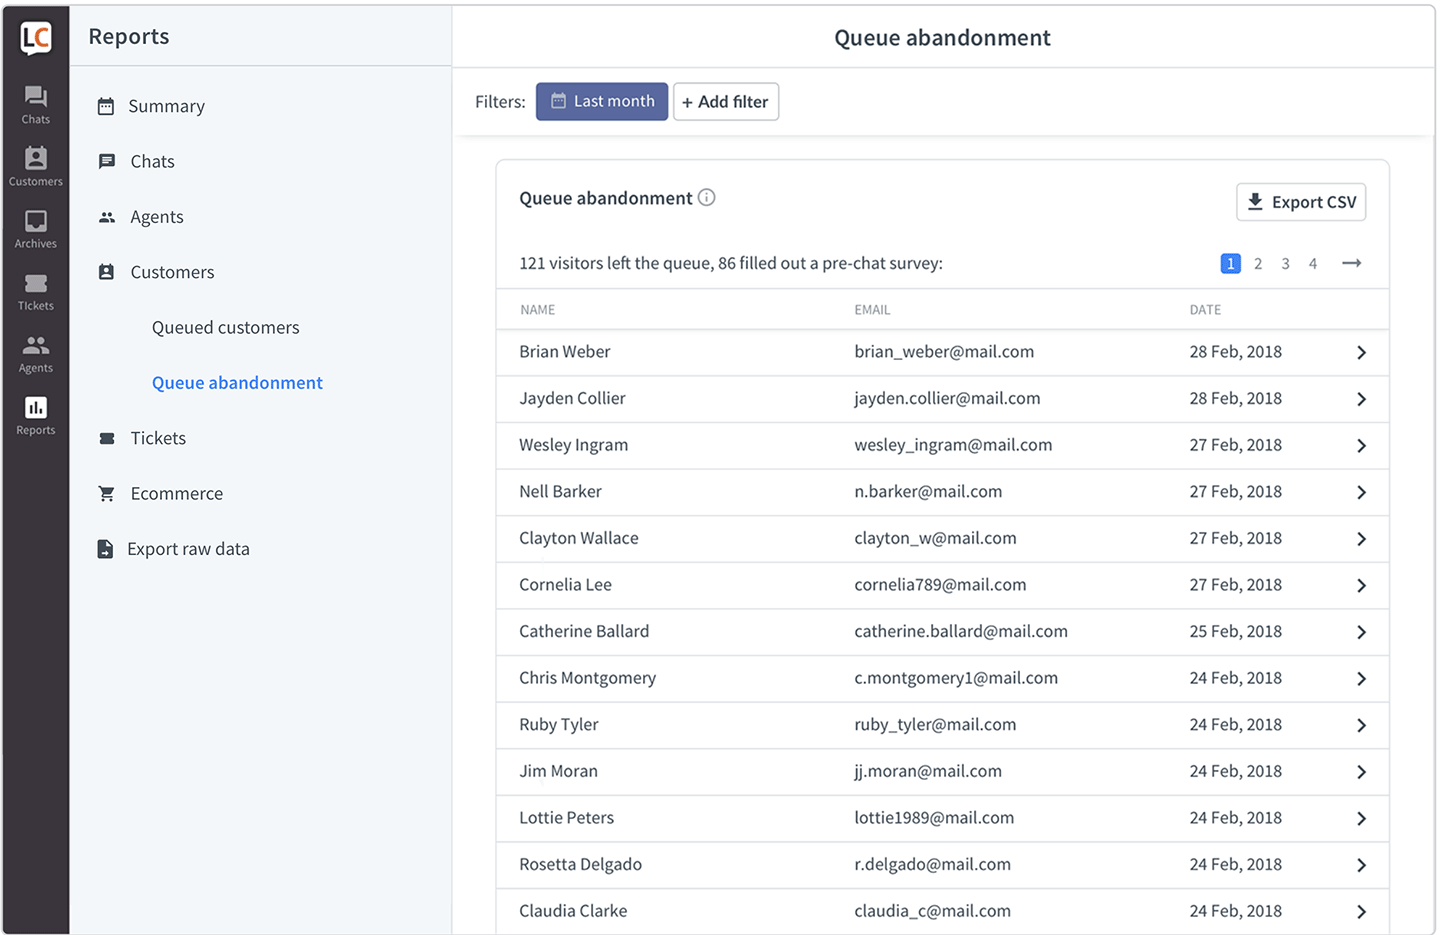
Queue abandonment report
Check the list of visitors who left the queue before talking to an agent. You can follow up on them and catch potential customers that slipped through the cracks.
Chat forms report
The post-chat forms report gives your more information about your customer satisfaction. You can ask additional questions about your service, and based on the answers, start improving things.

Only closed questions are stored in this report. If you leave an open question in one of the forms, you will have to check in Archives for those answers manually.
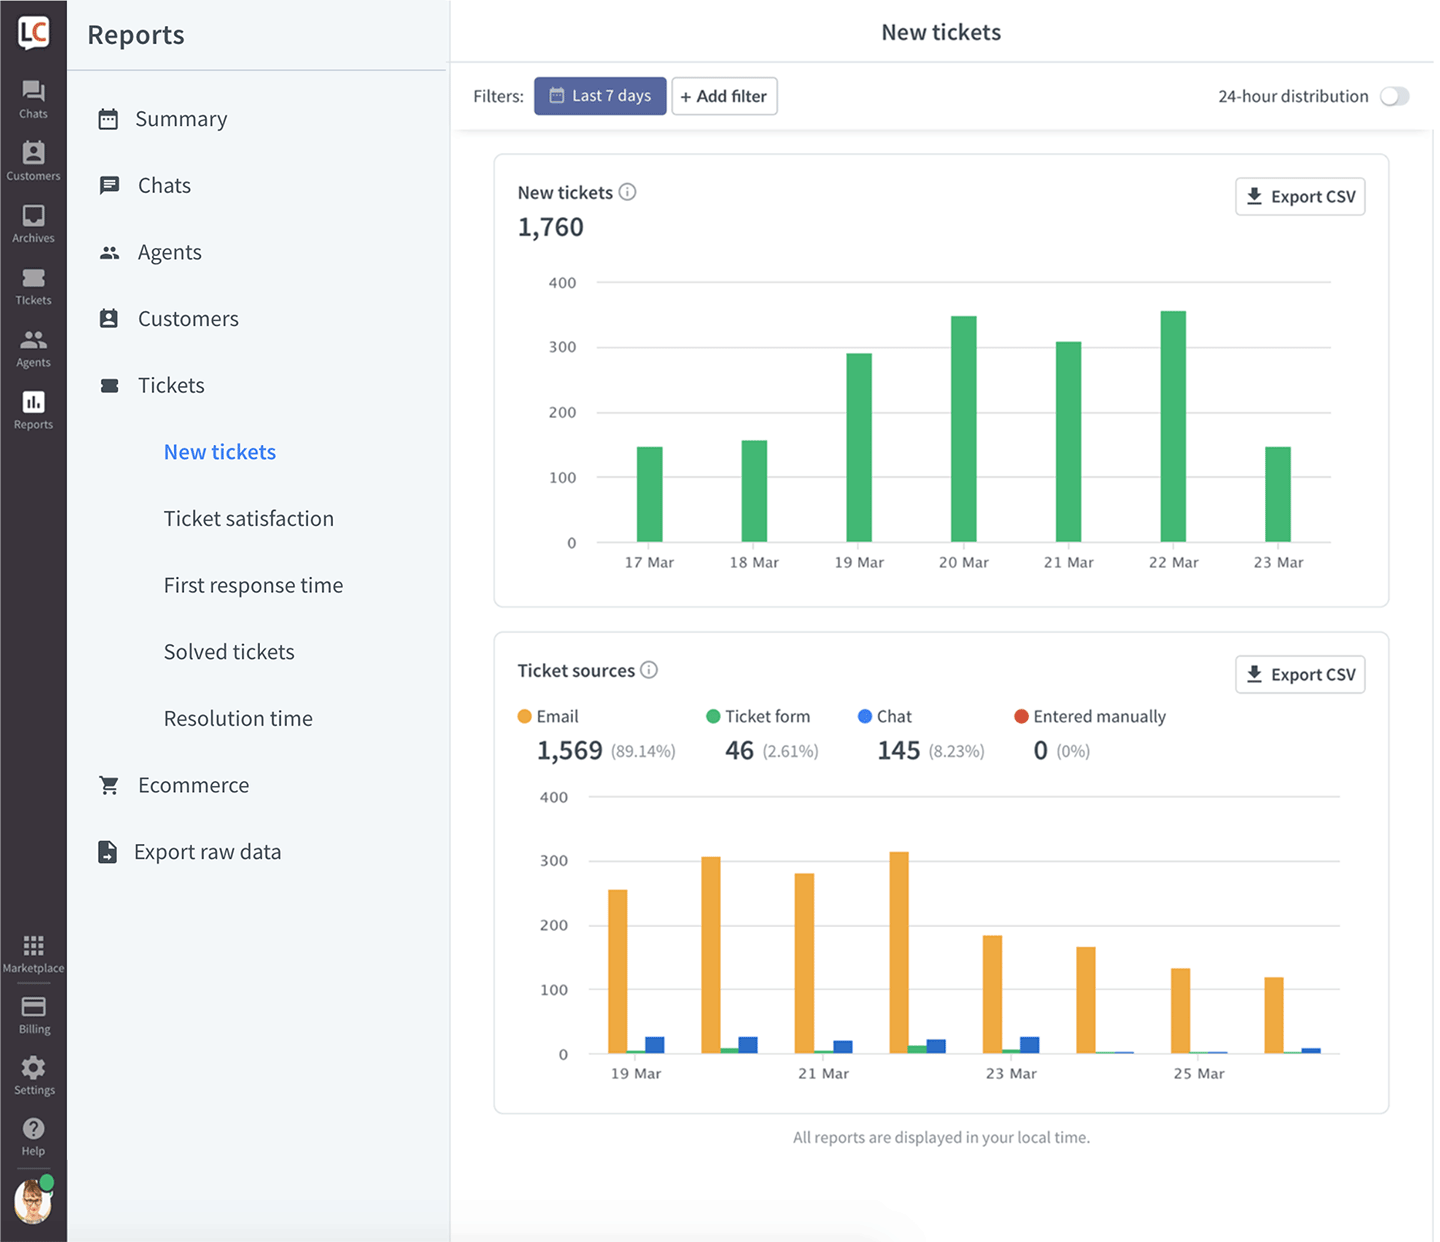
New tickets report
Check how many tickets you get and where they are coming from. If the number of tickets from the ticket form is rising, then you should consider extending your work hours.
Ticket satisfaction report
See if your customers are happy with how your agents take care of the cases via email.
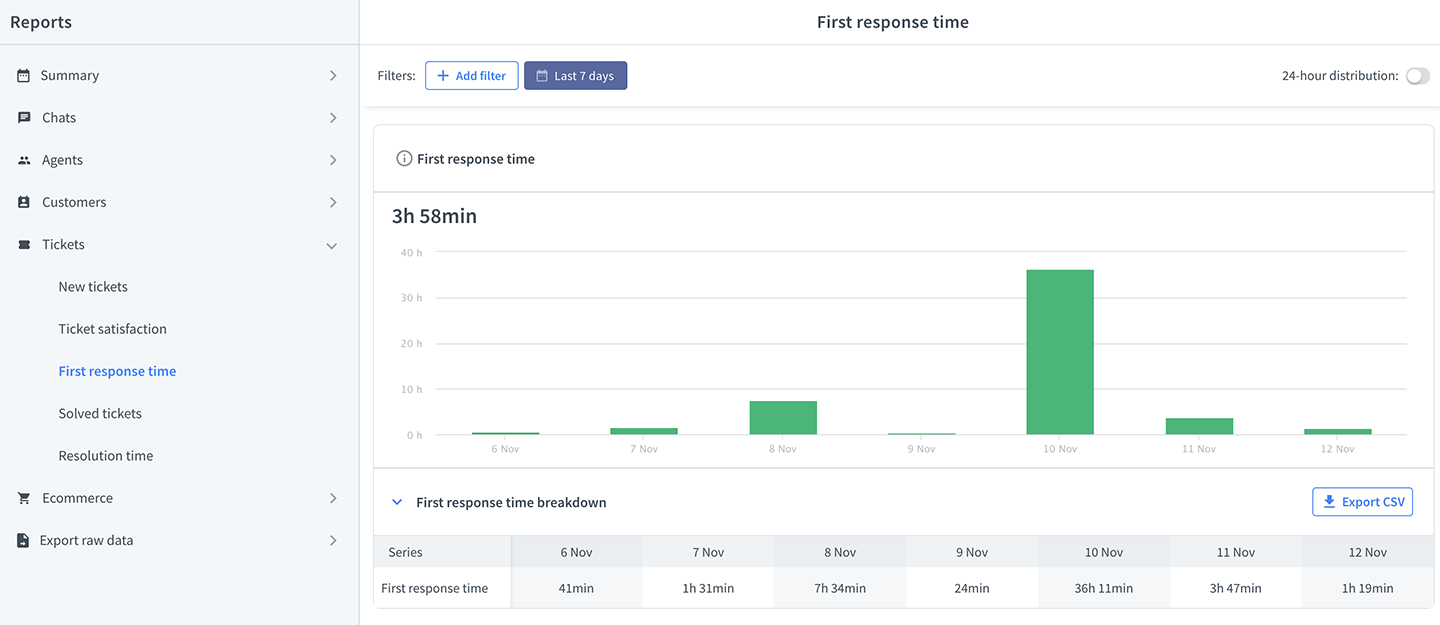
First response time report
Check how long it takes for your agents to respond to a ticket for the first time. Keeping these numbers low is important for high customer satisfaction.
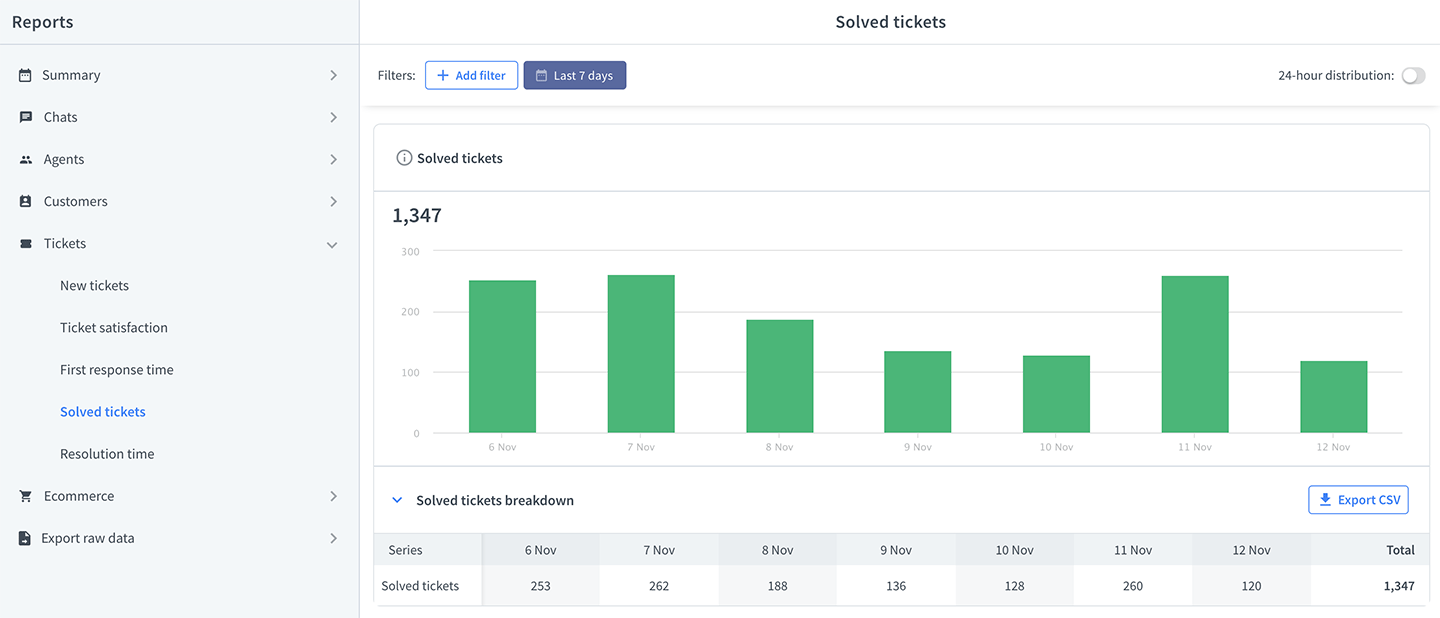
Solved tickets report
View how many tickets your agents solved, compare the number from agent to agent, and from group to group to see if there are any differences.
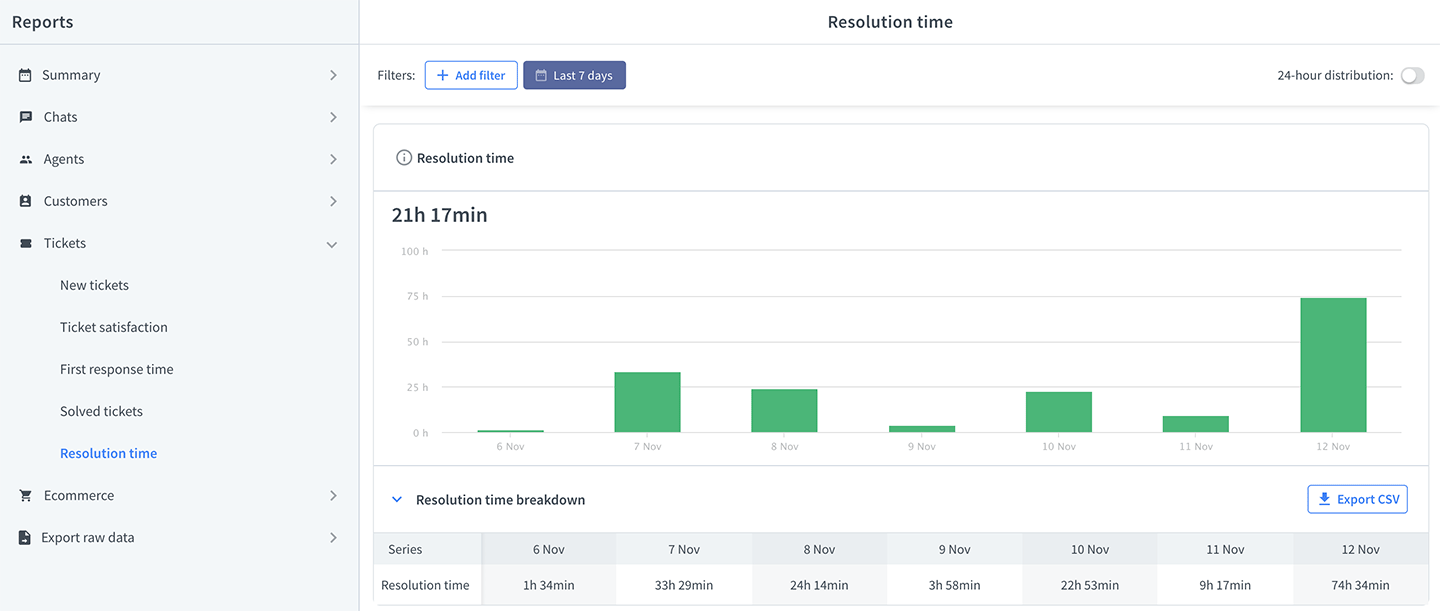
Resolution time report
See how long it takes for your agents to solve a ticket. The faster your agents solve cases, the happier your customers are.
Achieved goals report
Set up measurable goals for your chats to get a precise view of how your operation performs.
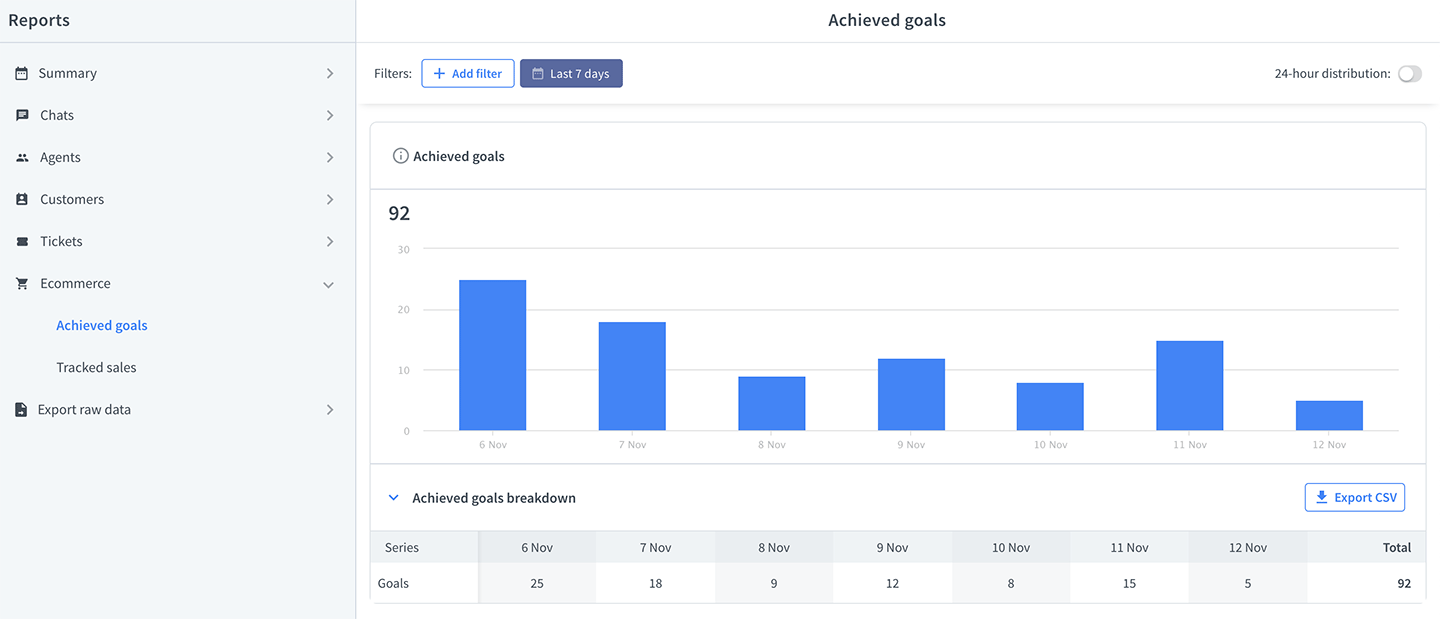
Check how many goals you achieved with LiveChat reports. Compare your results weekly to see if there is an upward tendency.
Tracked sales reports
Tie the Sales Tracker to your online shop and see exactly which chats bring you revenue.
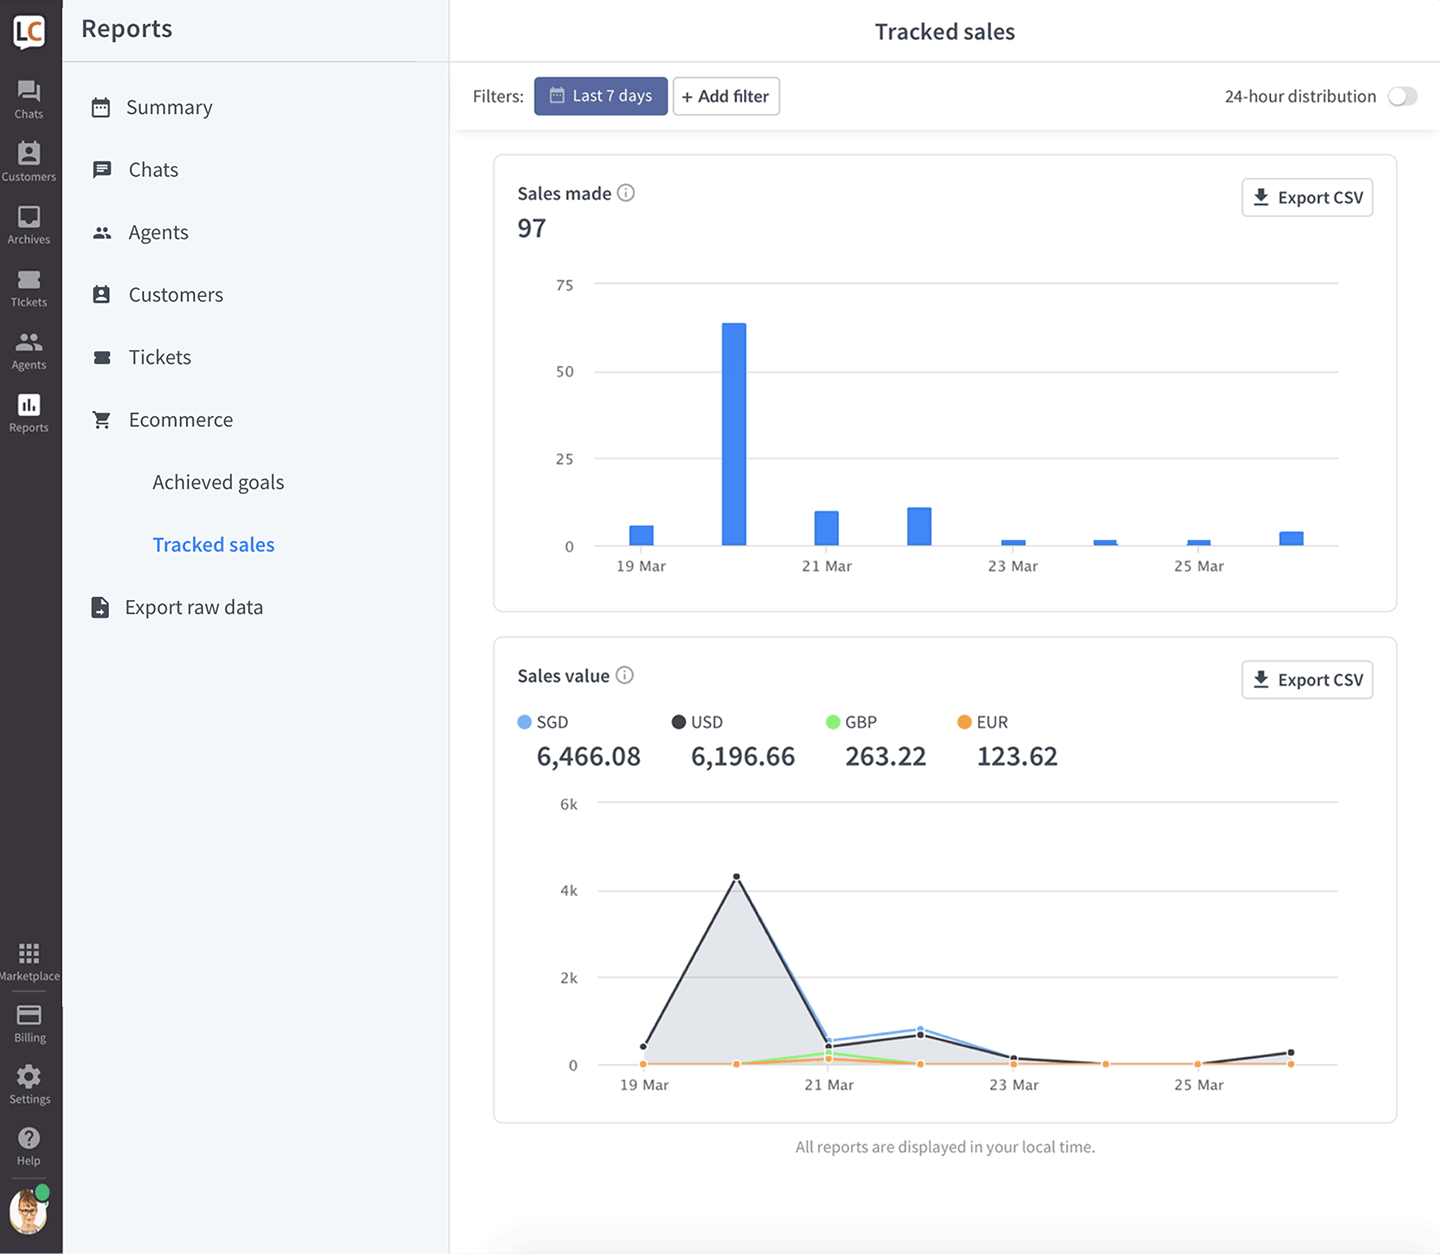
Measure how many sales you made and how much money precisely they brought to your business. If sales are an essential part of using LiveChat, keeping track of this report is a must.
Reports available on the Business and Enterprise plans
There are an additional four reports available only on the Business and Enterprise plans.
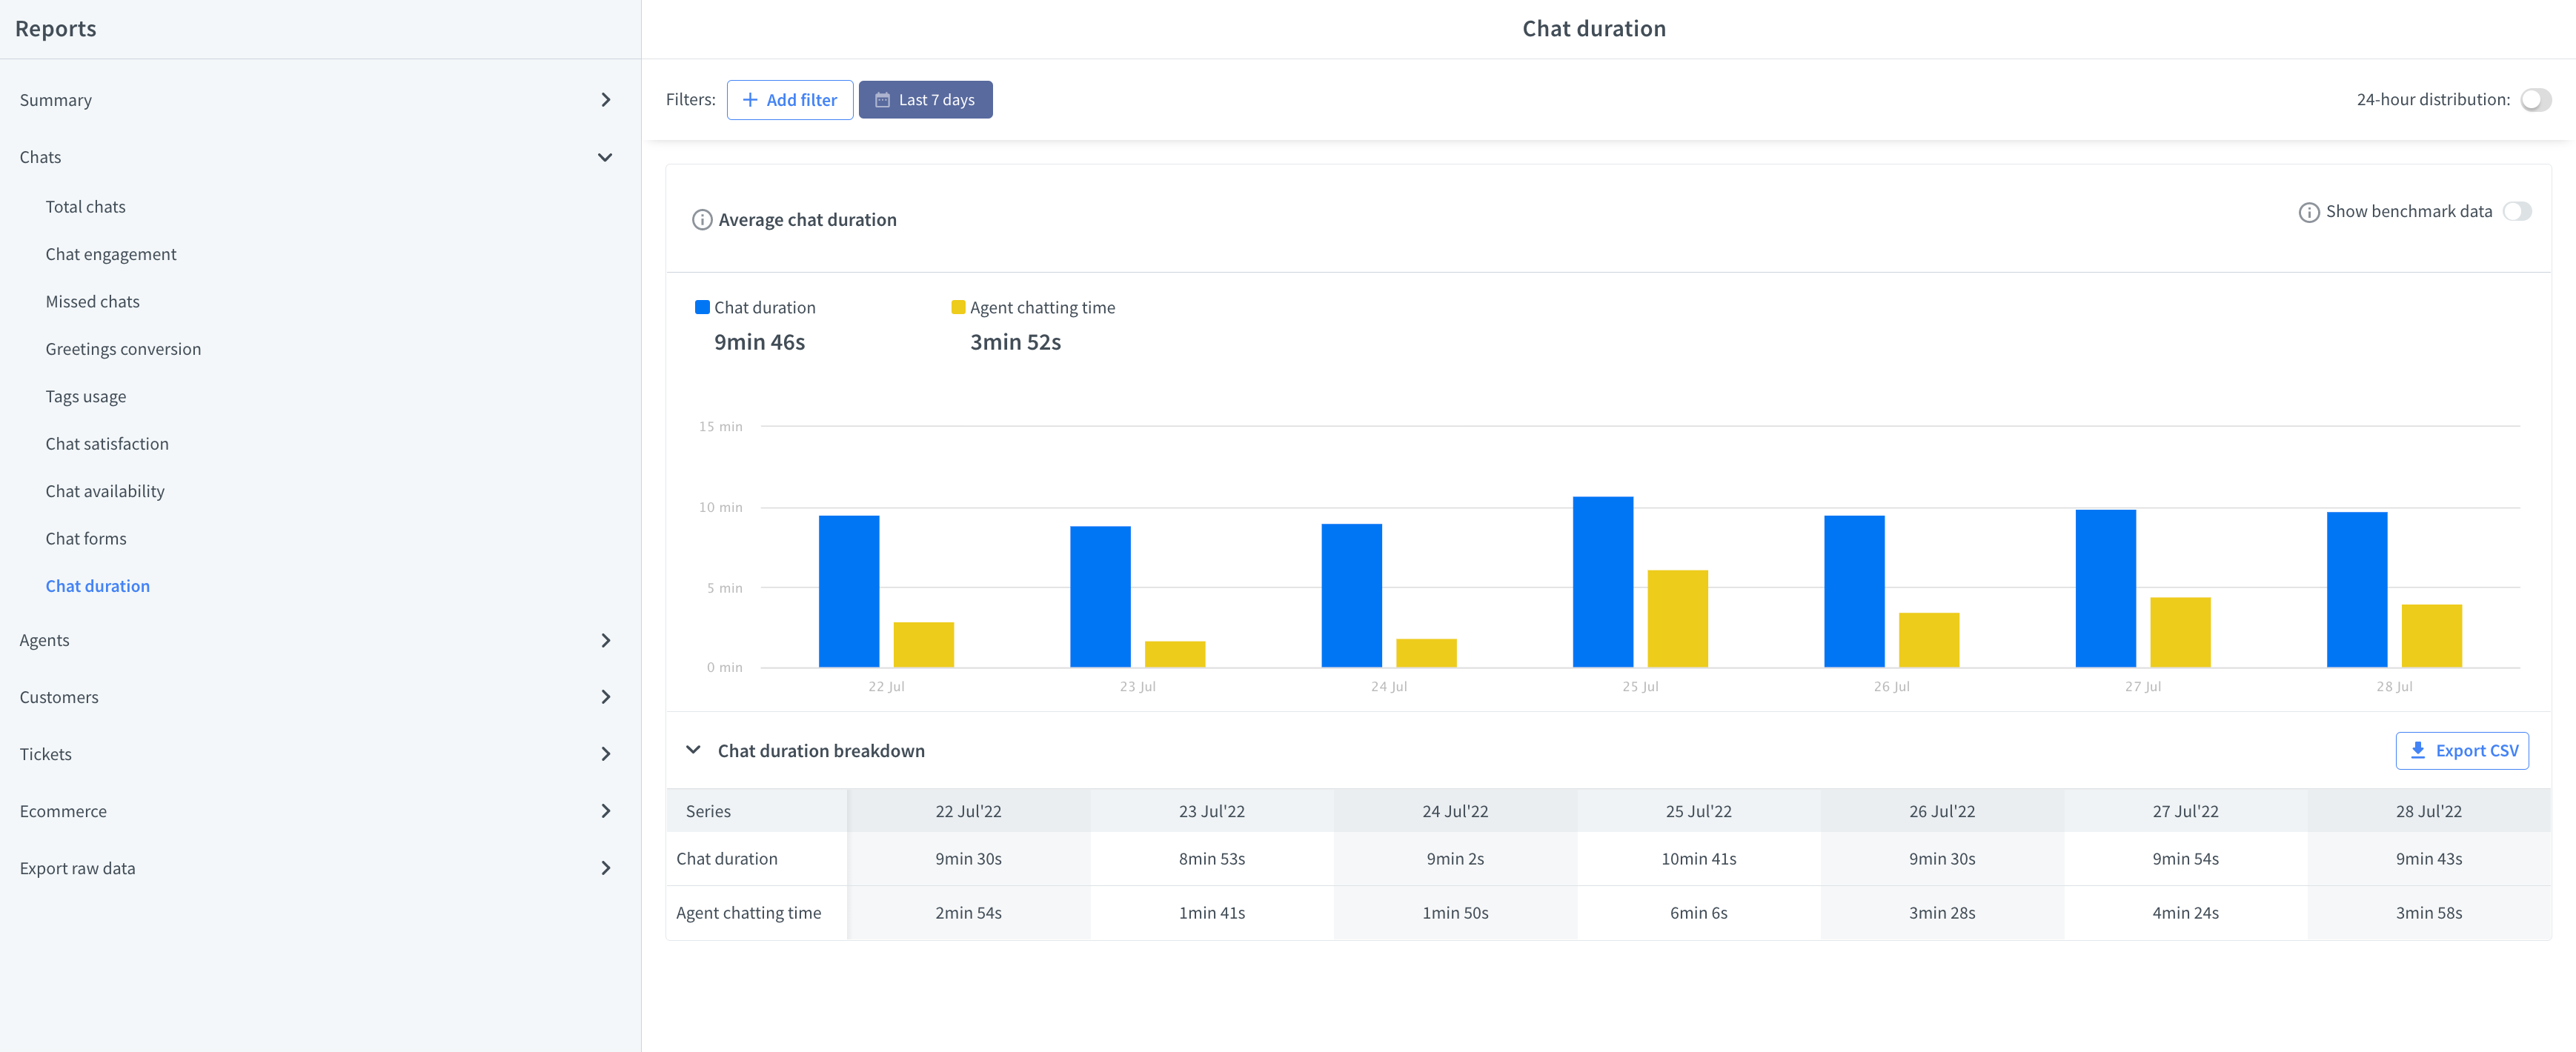
Chat duration report
This report shows how long a chat takes on average for a given period. It also compares agent chatting time with the entire chat duration.
- Agent chatting time – shows how much time agents spend chatting with customers.
- Chat duration – includes the chatting time of your agents, the chatting time of bots, and the time spent in queues.
Check the total average and compare it to the average of a specific agent to see if they take an appropriate amount of time to solve cases.
Bear in mind that average duration can vary between chats, based on the topic and the complexity of the issue. If you use groups and/or tags, check the average for them and then compare the number to a specific teammate.
Response times reports
This report shows you how quickly your agents respond to new chats and how fast they are when replying in ongoing conversations. No one likes to wait, so try keeping these numbers as low as possible.

How we calculate the response times
To measure the first response time of your agents, we check how much time passes from the first message a customer sends to the agent’s reply. The automatic campaigns that starts the conversation is not included in these statistics.
The average response time report is very similar. It shows the data about response times for all messages sent by agents.
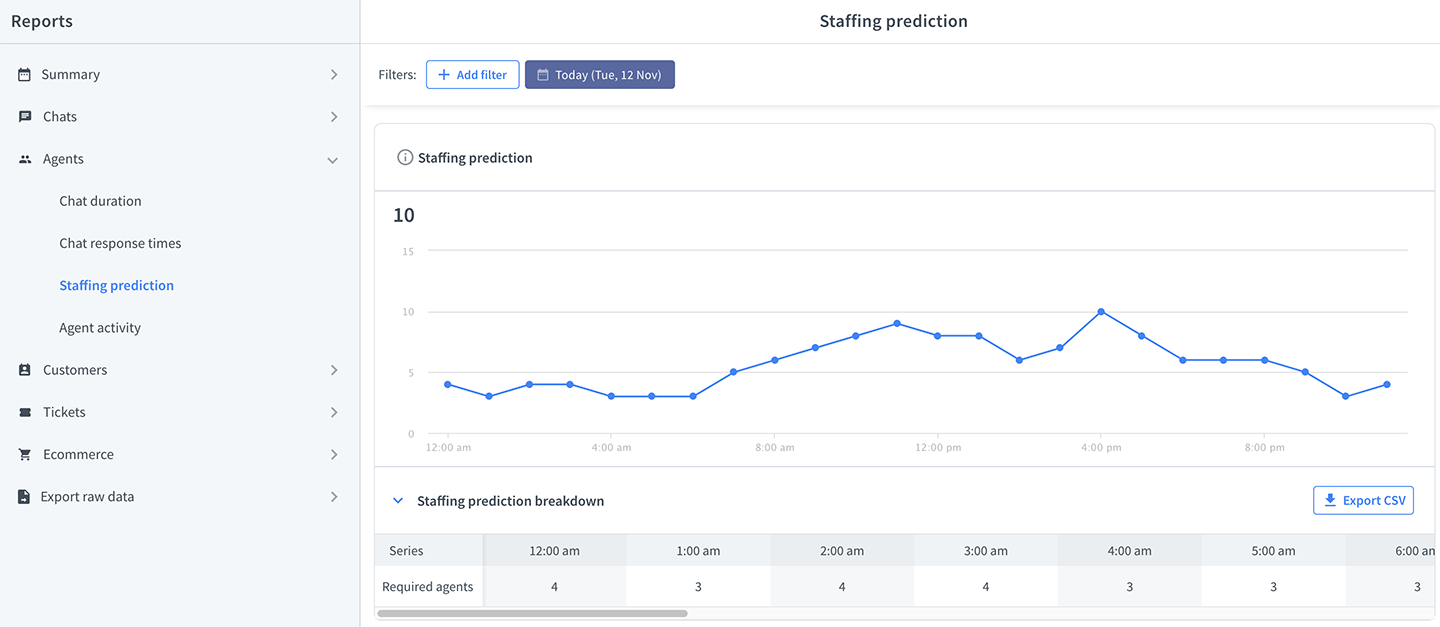
Staffing prediction report
Check how many agents you need to handle all incoming chats effectively. Shows hourly data for the next 7 days.
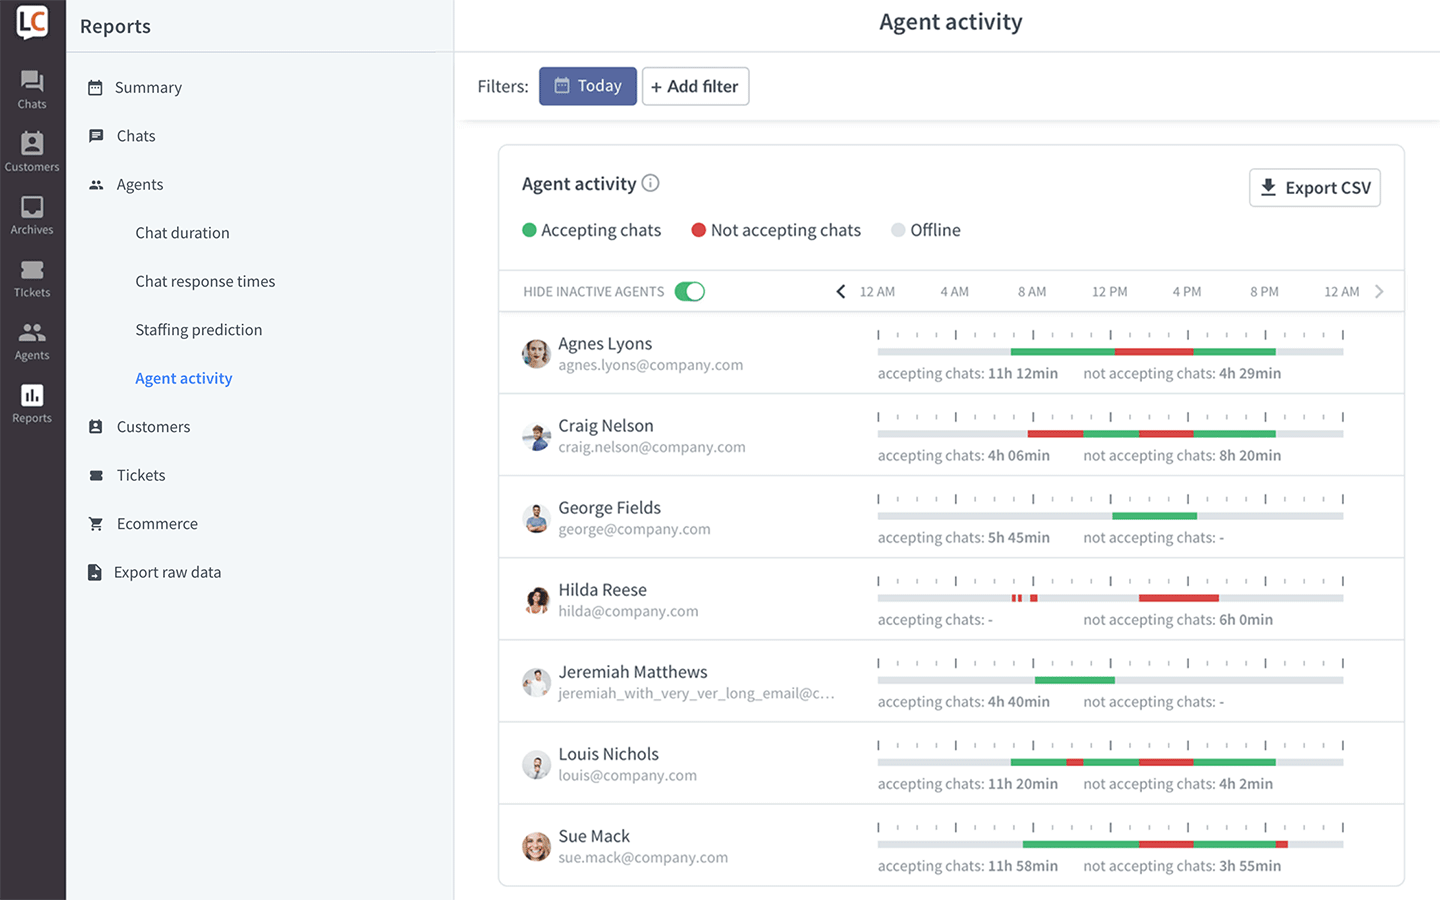
Agent activity report
See when your agents were online and if they were accepting chats. Keep track of your teammates’ statuses in real-time.
Using reports with different goals in mind
Depending on what metric you want to track, you can use a different set of reports. Some of the reports can also be used to serve different purposes. For example, you can use the chat satisfaction report to evaluate an individual agent’s work, as well as keep track of the general satisfaction of your customers.
Optimize your account
These reports are useful at any time but are especially important when you are just starting with LiveChat:
- Campaigns conversion report—‘campaigns’ is a feature that LiveChat can’t go without. But it needs to be set-up correctly to bring value. With this report, you can see which campaigns perform best and which need some fine-tuning.
- Queued customers and queue abandonment reports—see how long your customers are willing to wait and how many opportunities you miss because your agents can’t accept more chats. Follow up on customers that left the queue.
- New tickets reports—check out the ticket sources, if you get a lot of tickets coming from the ticket form, maybe it’s time to extend your work hours.
Track LiveChat’s performance
When you added LiveChat to your site, you probably had a goal in mind. Maybe you wanted to increase sales or provide better customer support. Here are a few examples of how you can measure how LiveChat is performing:
- Tracked sales reports—see the value of sales made with LiveChat.
- Achieved goals report—check how many times LiveChat helped you achieve a pre-set business goal (e.g., a customer signs up for a demo on your site).
- Total chats and new tickets reports—learn how many opportunities LiveChat created for you to make a sale or fix your customers’ problems.
Track your team’s performance
- Chat and ticket satisfaction reports—see how your customers rate your agents. Let the best agents teach less experienced teammates.
- Ticket first response time and chat response times reports—customers don’t like to wait, so it’s important to make sure that your agents reply as soon as possible.
- Chat duration report—see if your agents take enough time to help every customer while still being productive.
- Ticket resolution time report—check if your agents take care of complicated cases and don’t make your customers wait too long.
- Solved tickets report—see how effective is your team, compare this metric between groups and agents to see if there are areas where tickets are easier/harder to solve.
Manage your team
All reports mentioned in the previous section can be used to view and improve your agents’ performance, but also to know if you don’t need extra people on board. We also have dedicated reports that can help you plan shifts:
- Staffing prediction report—foresee how many agents you need to cover a shift on a specific day and at a specific time.
- Agent activity report—see who is online, and what status they have on. So you can see decide if there is extra help needed in real-time. It’s also very helpful to track your remote agents’ work.
Advanced reporting features
Filter data
Filters come in handy when you want to look for trends, see data for a specific period, or check how particular agents or groups are doing.

When you filter by multiple tags, the report will include either results with all the tags (Match all), or for at least one of the tags of the tags (Match any).
Filter by tag
Using the ‘tag’ filter, you can get precise information on a particular type of case or see if there are products that are getting very popular. For example, you can check how many chats were tagged as ‘product_request’ to know if you should add them to your store.
To learn more about tags, check out this guide.
Filter by date
Filter by a particular ‘date’ to check your LiveChat activity during various campaigns, holidays, or other seasonal events. Just started a new ad campaign? See how the chat traffic went up for that period. Noticed a decrease in the number of chats during the summer? Your customers are probably on vacation.
Filter by agent
To check on a particular agent, select him or her using the ‘agent’ filter. This option is beneficial during agents’ evaluation as it shows data for one agent only.
Filter by group
Filter the data by ‘group’, to see how many chats all of your departments had. If you are using groups to offer chat on multiple websites, this filtering option allows you to check the data for each of those websites separately.
Filter by assignment
Filter the data by ‘assignment’ to see how many chats were assigned to an agent and how many were unassigned.
Filter by availability
Filter the data by ‘availability’ to see how many chats were started when your agents were online and how many when they were offline.
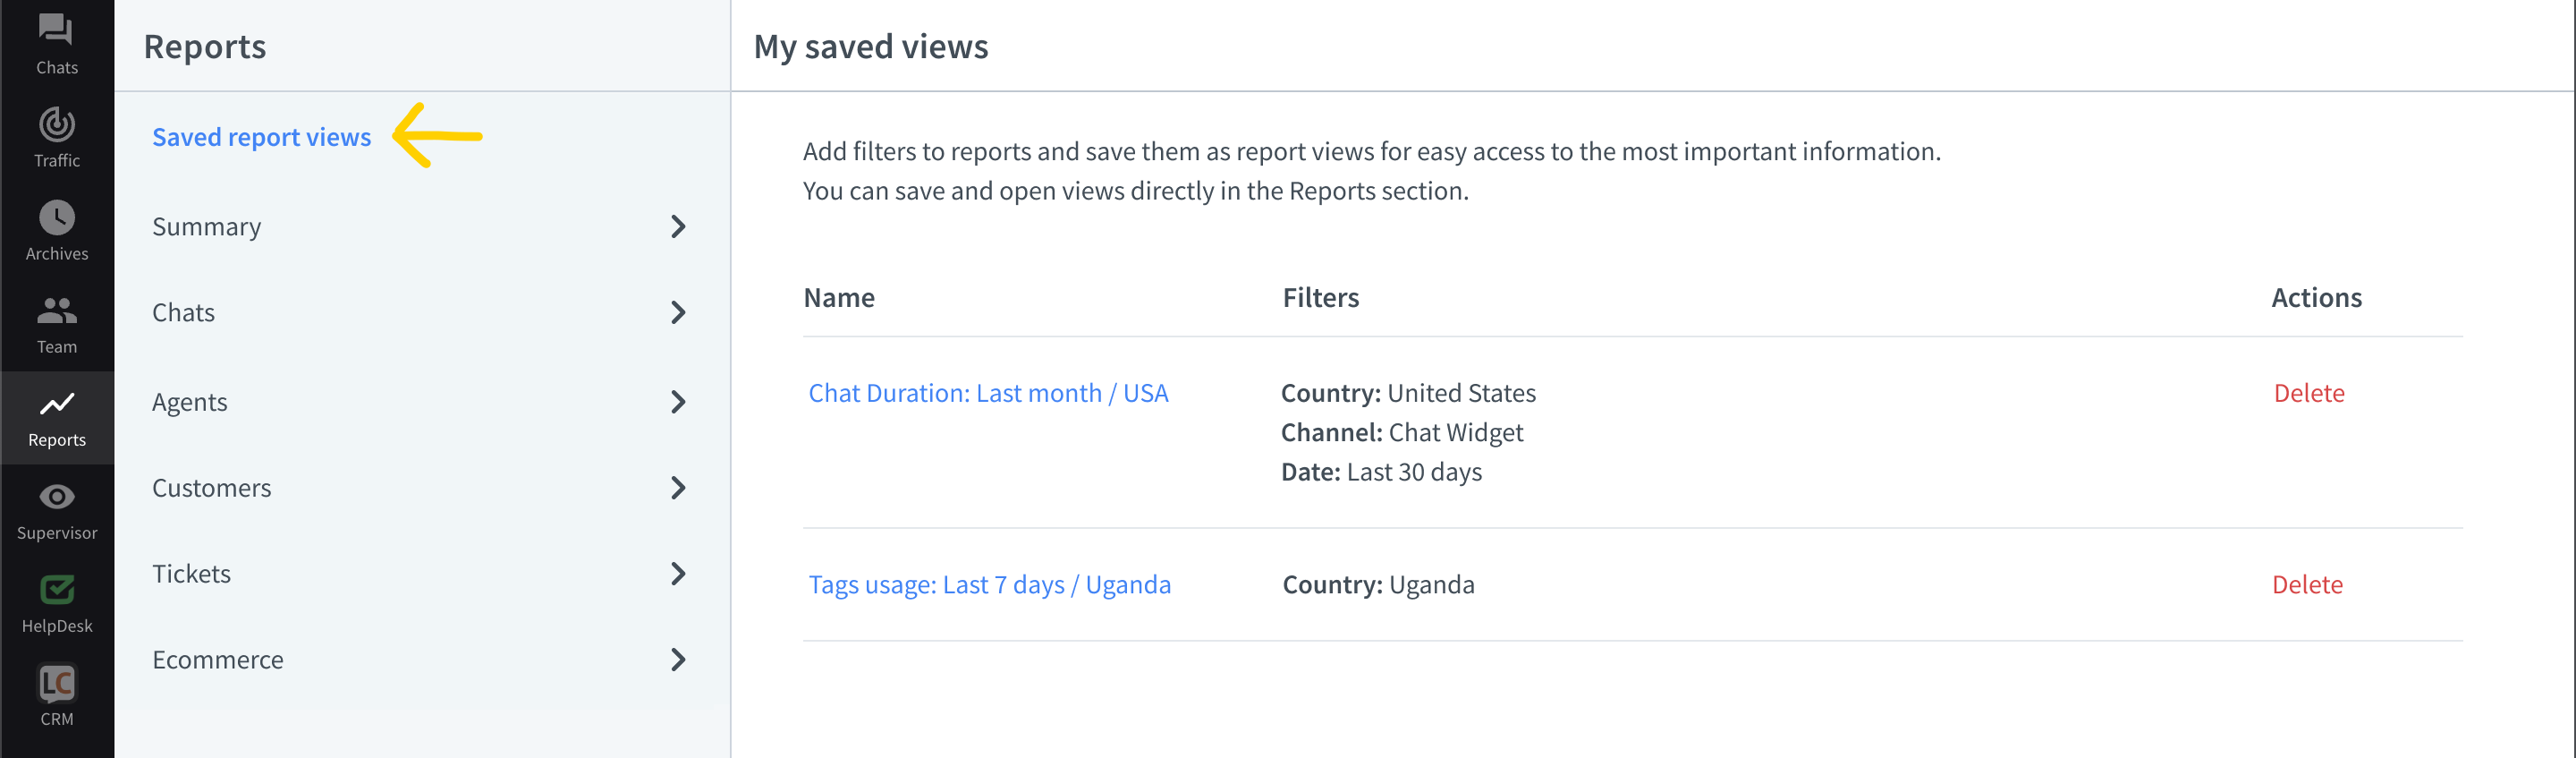
Save filtered views
Once you know which filters show you the most valuable data, save the filtered views to create your custom reports.
When you’ve filtered the report, select Save view.

Name the filtered view and save. Once you’re done, you’ll be able to pick the saved segment from the drop-down menu in the top right corner.

You can view all your saved views in Saved report views.
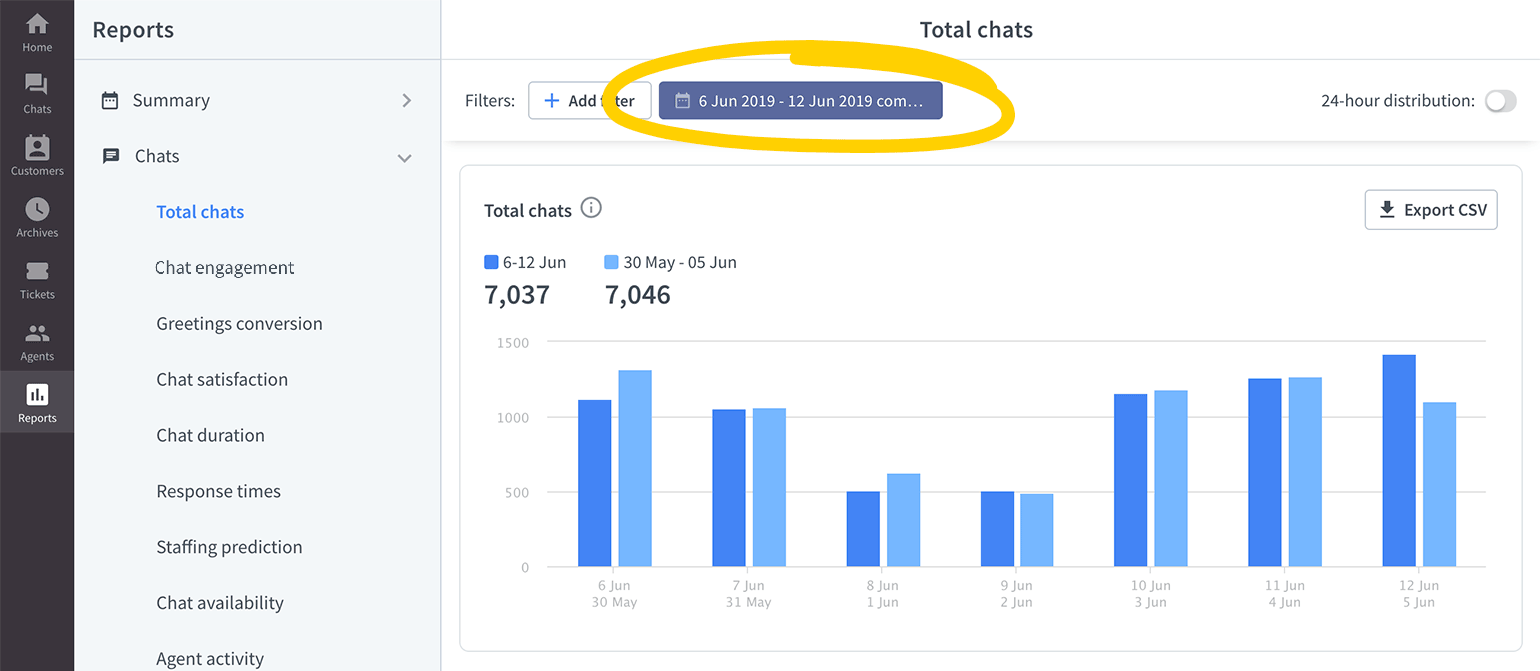
Compare past and present data
You can check how your metrics change from day to day, week to week, or month to month in one report. It’s perfect for keeping track of the results of your actions.
Let’s say you wanted to increase the number of chats coming from your product pages by adding campaigns and changing the look of the chat widget. After having introduced the changes, you can check if they’ve brought results.
See hourly data
To see how data distributes during the day turn on the 24-hour distribution. You can do it by clicking on the toggle button in the top right corner of a report.
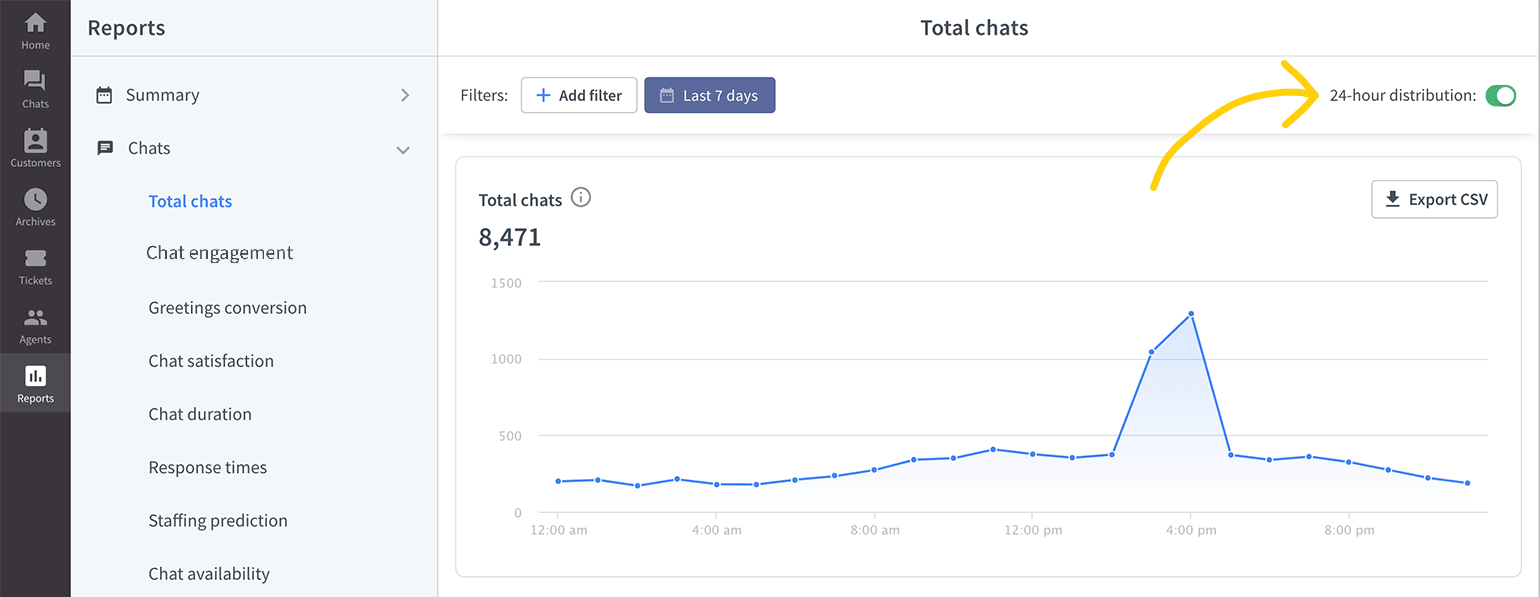
It’s convenient if you want to predict how many agents you need based on the number of chats you receive at a particular time of the day.
Get an even closer look at how your workload changes throughout the day with heatmaps available in ’total chats’, ‘queued customers’, and ’new tickets’ reports.
Get more info with interactive reports
Some of the reports offer more detailed data when you hover over or click on them.
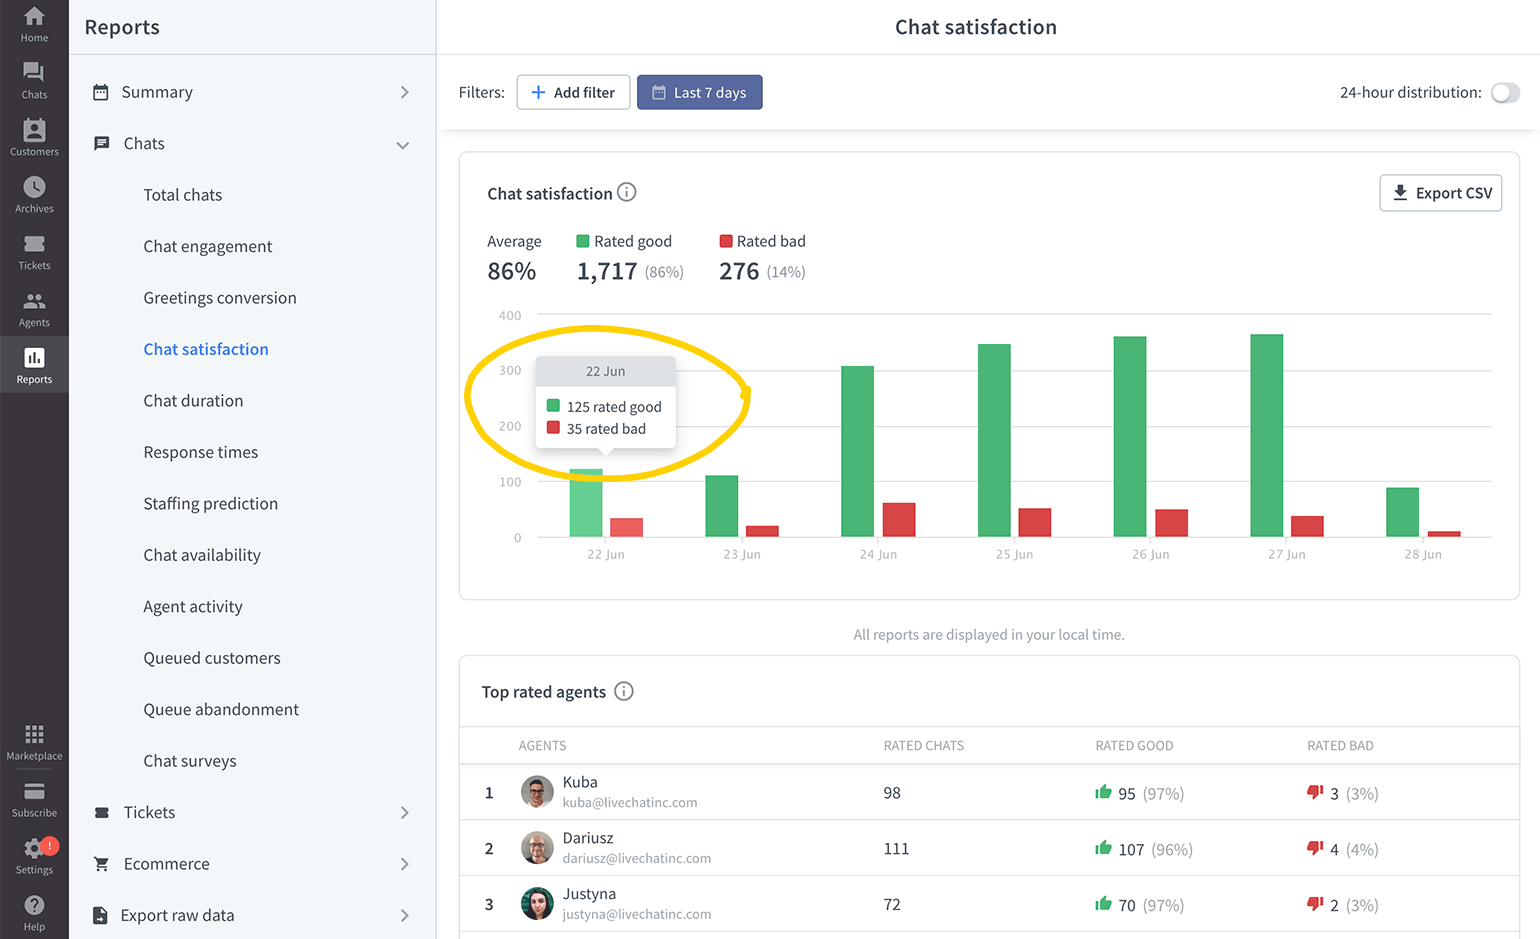
For example, by hovering on the data column in the ‘chat satisfaction’ report, you can view a specific number of positive and negative ratings. When you click on the negative rating column, you will see all the chats rated ‘bad’ in Archives.
Export data to create your own reports
You can download each report if you are on the Team plan or higher. Additionally, you can export raw data if you are on the Business and Enterprise plans.
Download reports
To create your own analytics tool, you can download a set of reports and gather them in a spreadsheet. That way, you can easily compare and cross-check them with data coming from other tools you use in your daily work.
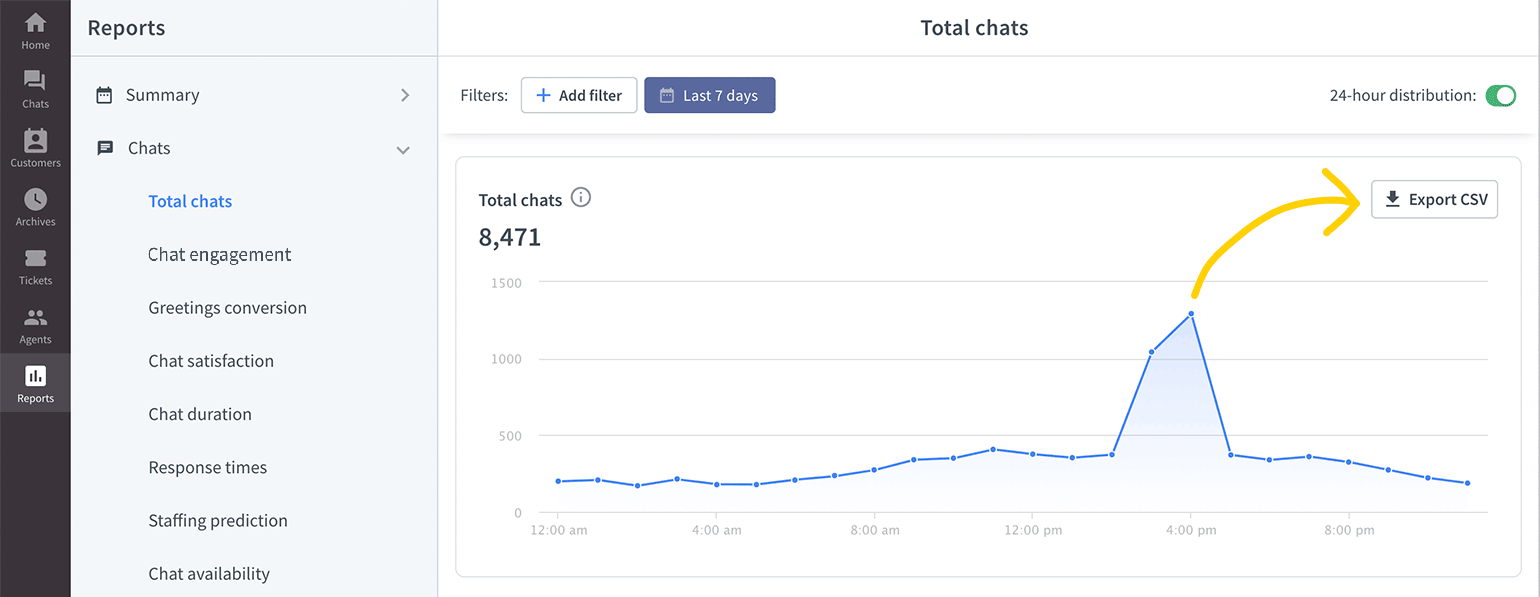
To download a report, just go to one, and click on Export CSV.
Export raw data
Exporting raw data allows you to get much more data on your chats, surveys, queues, and goalsthan just downloading a report. It is extremely useful if you want to create your own complex analytics tool.
Try exporting raw data in the LiveChat app.
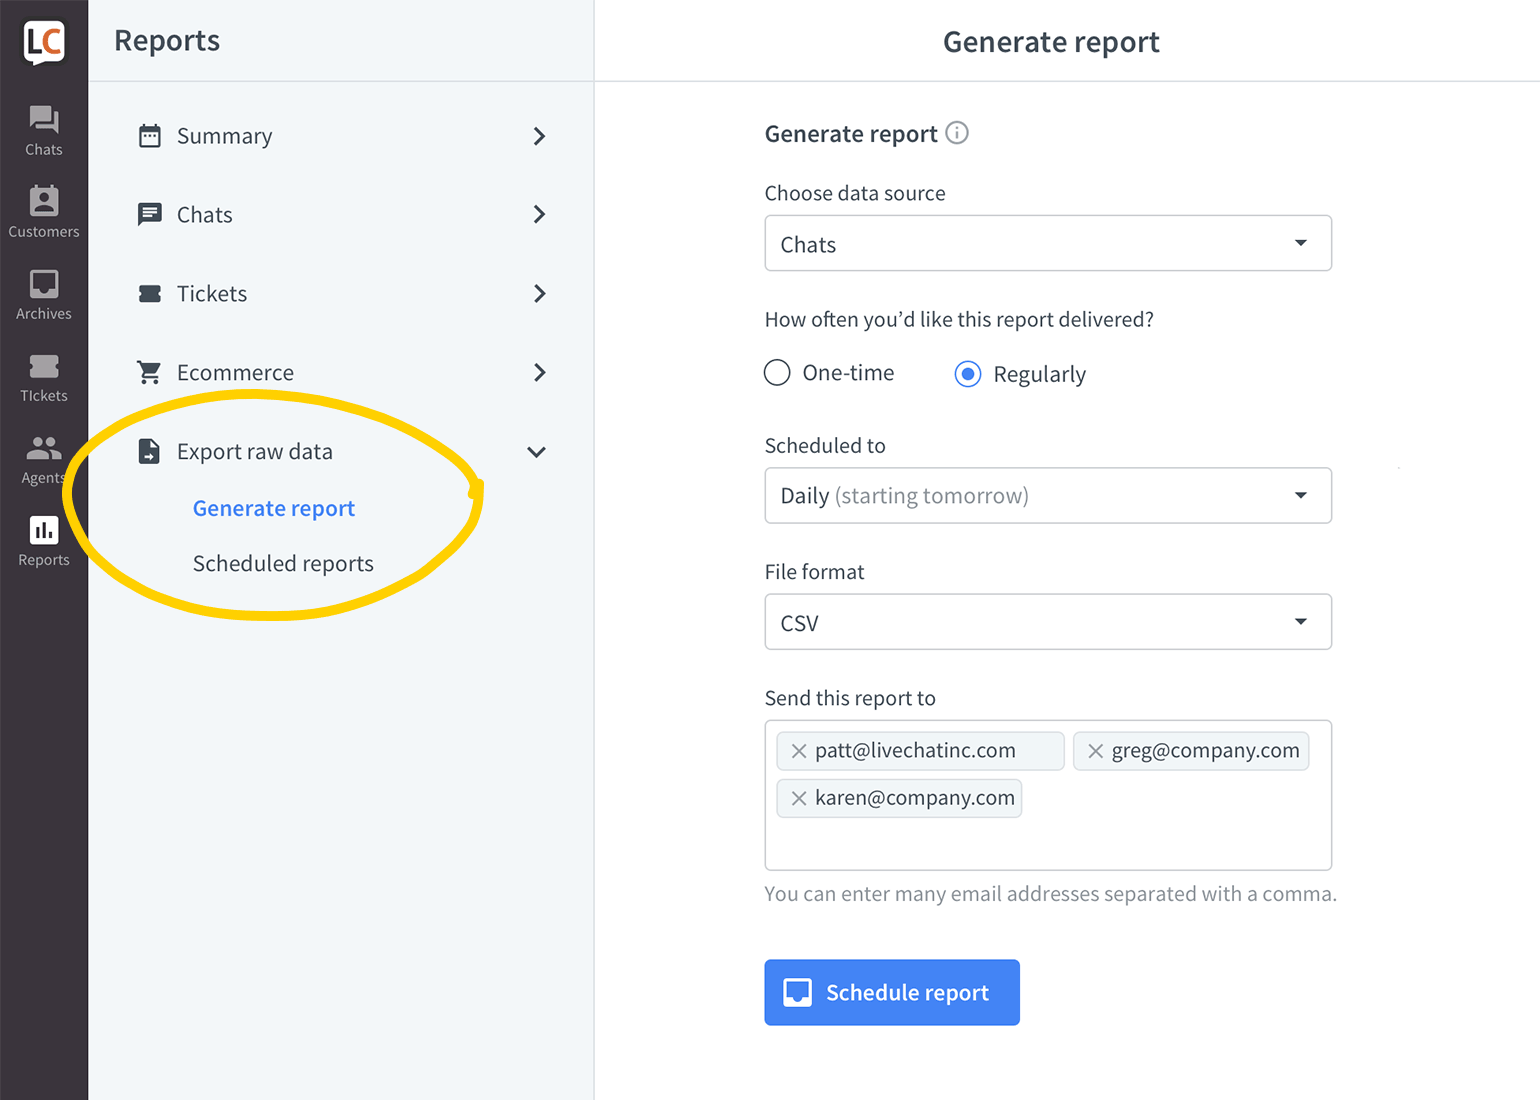
You can set the raw data report to generate automatically every day, week, month, or any other time. Once set, you don’t need to think about them anymore, as they will send straight to your email.
Here’s a full list of raw data you can export:
The data from Chats report (records for individual chats):
Note that, when exporting your Chats, the report is limited to the latest 100000 records on your LiveChat license. If you have more than 100000 chats on your license and you want to export all of them, you will have to export the Chats report in parts.
To do that, please use the Data range: Custom filter and include the data range that covers the first 100000 chats. Then, export another report with the data range that covers the rest of your chats.
- Conference ID
- Chat creation date (and timezone)
- Chat start date (and timezone)
- Chat start URL (on what page the chat started)
- Referrer
- Chat duration (in seconds)
- Queue duration (in seconds)
- Visitor’s LiveChat ID
- Visitor’s name
- Visitor’s IP
- Last operator’s ID (the agent that chatted with the visitor previously)
- Skill
- Rate
- Agent’s name
- Agent’s ID
- Agent’s timezone
- Pre-chat survey information
- Post-chat survey information
- Campaign URL (on what page the campaign was displayed)
- Campaign action (the condition that triggered the campaign)
- Goal name
- Goal credit
- Goal date
- Tags
- Custom variable name
- Custom variable value
- Integration variable name
- Integration variable value
- First response time (in seconds)
- Average response time (in seconds)
- Group status at start
Information from the Queue abandonment report:
- Conference ID
- Queue start time (and timezone)
- Queue duration (in seconds)
- Queue start URL
- Skill
- Visitor’s LiveChat ID
- Visitor’s name
- Visitor’s IP
- Pre-chat survey information
- Custom variable name
- Custom variable value
- Integration variable name
- Integration variable value
Information you can get by exporting the Goals report:
- Goal ID
- Goal name
- Conference ID
- Chat start date (and timezone)
- Goal achievement date (and timezone)
- Agent’s ID
- Skill
- URL (where was the goal triggered)
- Order ID (additional information that can be added to the goal via API)
- Order description (additional information that can be added to the goal via API)
- Order price (additional information that can be added to the goal via API)
- Order currency (additional information that can be added to the goal via API)
- Custom variable name
- Custom variable value
The Tickets report will give you the following information when extracted:
- Ticket ID
- Ticket creation date (and timezone)
- Requester name
- Requester email
- Skill
- Rate
- Assignee’s name
- Assignee’s ID
- Status
- Subject
- Source
- Source URL
- First response date (and timezone)
- Used tags
Reviews
Reviews are highlighted comments left by your customers while positively rating your chats.
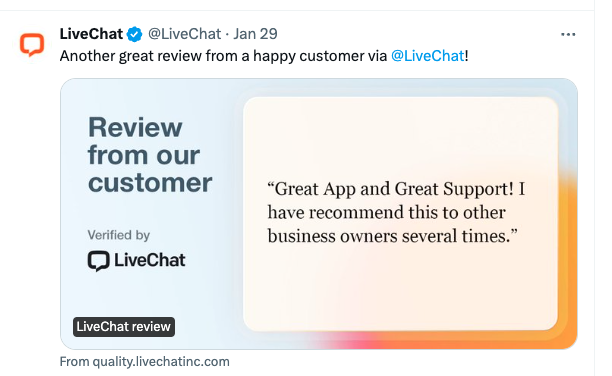
You can easily share your customers’ reviews on the popular social media platforms to promote your excellent customer service skills.
The reviews are displayed on a stylish background along with a Verified by LiveChat badge, setting it apart on feeds and walls.
Your reviews are stored in a dedicated Reviews section as a part of LiveChat reports. Visit it to find a full list of positive reviews.
Find the review you’d like to show off. Select Share, and then Share on X to seamlessly move to the X (Twitter) social media platform and confirm posting the review.
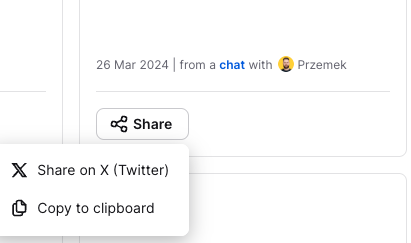
You can also copy the link to your review to clipboard to share it on other social media platforms, use it as a presentation for your manager or show it to your colleagues.
Configuration API documentation
You can create custom reports by pulling LiveChat data using our Configuration API. The API is fully documented, which will make the task easy. Simply create a request and save the results to a file that can be later on interpreted using Excel.
If you are not familiar with using APIs, we have an introductory article ready.